Page Descriptions
Navigation Bar
The navigation bar is static and remains visible in all views except the popup chart. It contains most project-wide functionality.
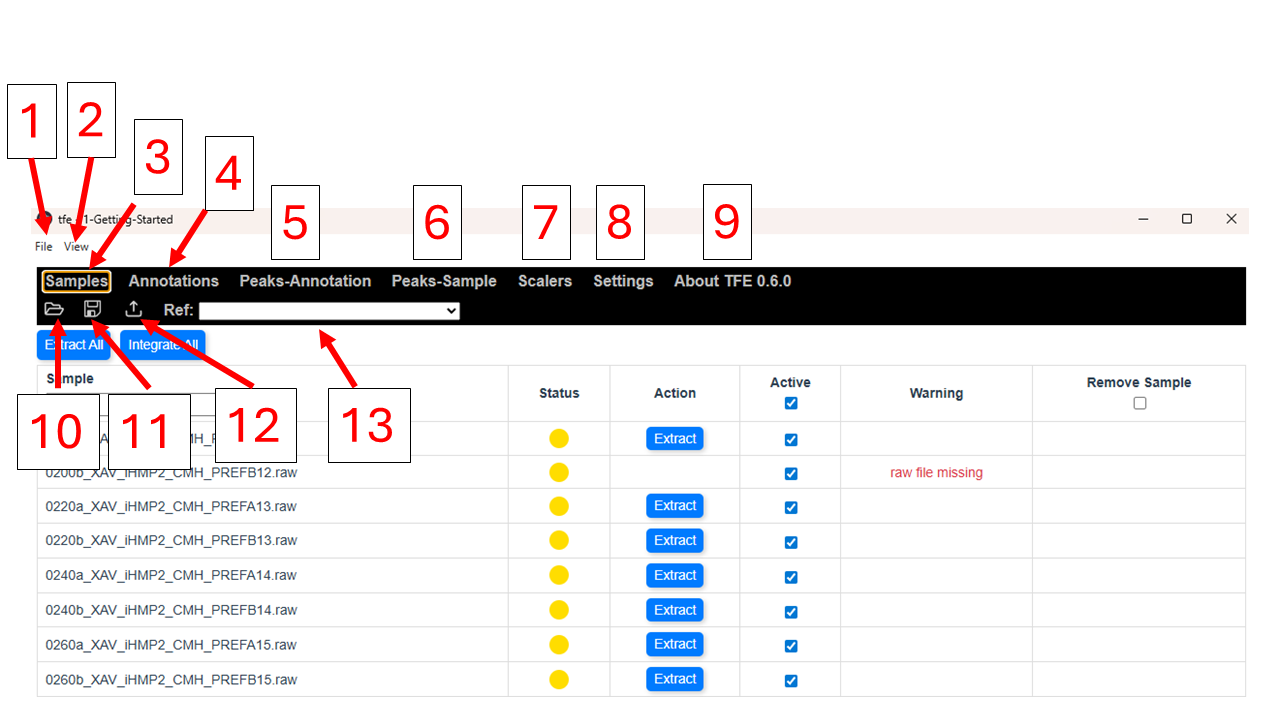
- File - Includes Open (Ctrl + O), Save (Ctrl + S), and Exit
- View - Basic zoom options
- Nav Button for Samples Page
- Nav Button for Annotations Page
- Nav Button for Peaks-Annotation Page
- Nav Button for Peaks-Sample Page
- Nav Button for Scalers Page
- Nav Button for Settings Page
- Nav Button for About Page
- Shortcut for Open
- Shortcut for Save
- Export Project Tables - Creates .csv pivot tables
- Reference - Uses the selected sample as an RT/MZ reference when exporting
Samples
The Samples page contains a list of samples and shows their status. This is the default view when opening a project in TFE.
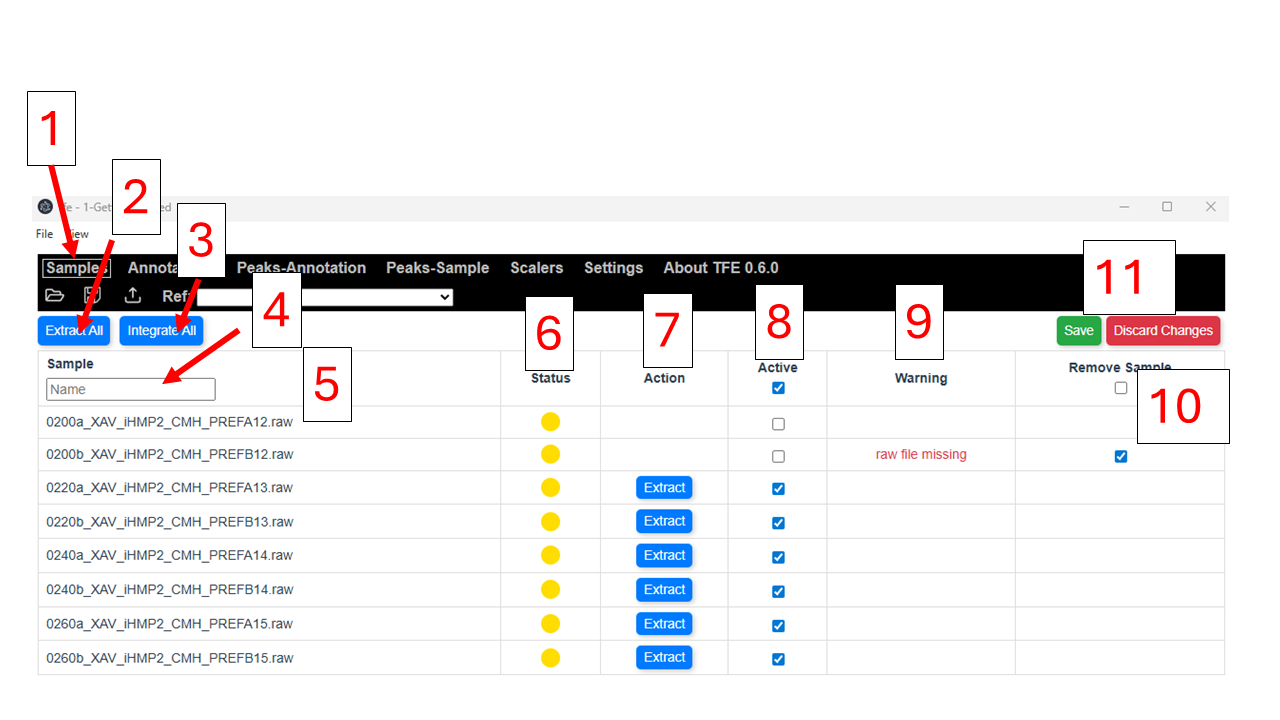
- Selected Page - Samples
- Extract All - Performs extraction on all samples for all annotations, including optional reextractions.
- Integrate All - Performs integration on all samples and annotations.
- Sample Search Box - Search for a sample by typing its name.
- Sample List
- Sample Status - Displays the highest-priority status for a sample: Incompatible > Reextraction Required > Reintegration Required > Optional Reextraction > Good. Yellow indicates that at least one annotation in the sample must be reintegrated.
- Extract Single Sample - Performs extraction on a single sample.
- Active - Indicates whether a sample is active, meaning it is included in the project.
- Warning - Displays any warnings for a sample.
- Remove Sample - The raw file must be deleted and the sample set to inactive before it can be removed.
- Save/Discard - Save or discard changes.
You may also select a range of samples with Shift + click, then right-click to open a menu containing the actions available on the page.
Annotations
The Annotations view contains the annotation list, extraction parameters, and integration parameters. You may make changes here or by editing annotations.csv while TFE is closed. Because there are many parameters, you may need to scroll horizontally.
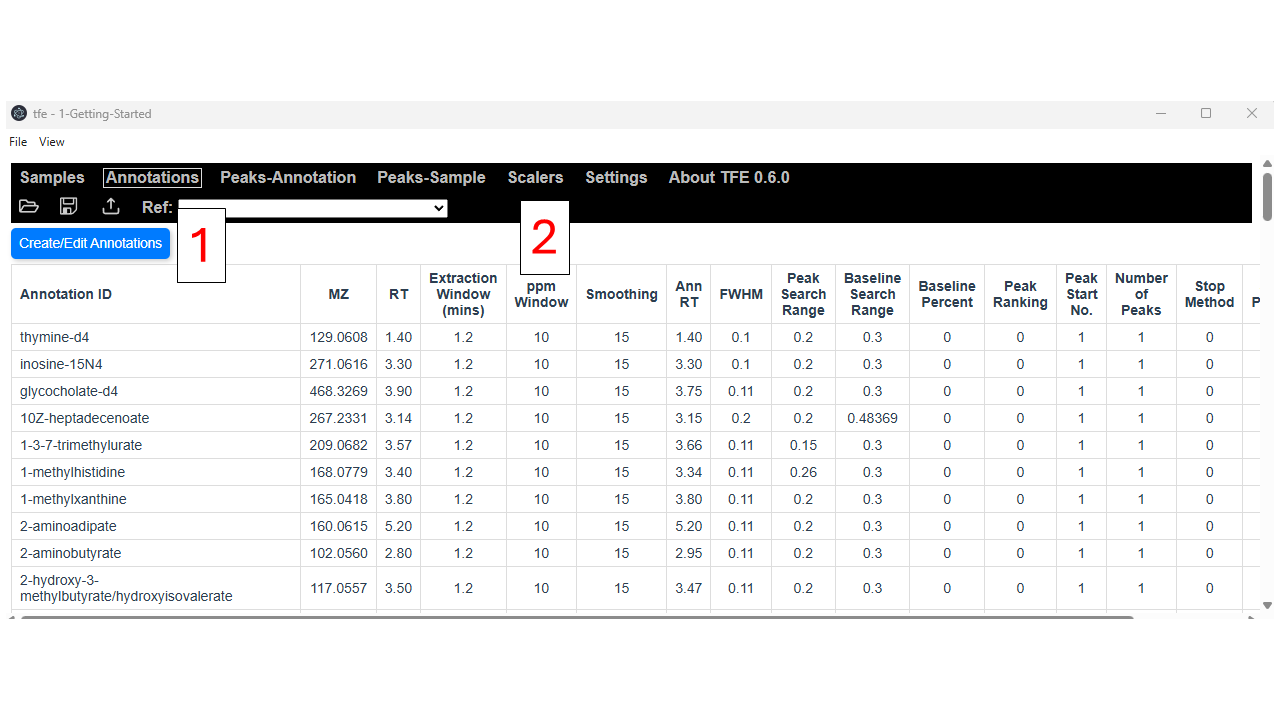 Default view, with no edits being made.
- Create/Edit Annotations Button
- Annotation Table
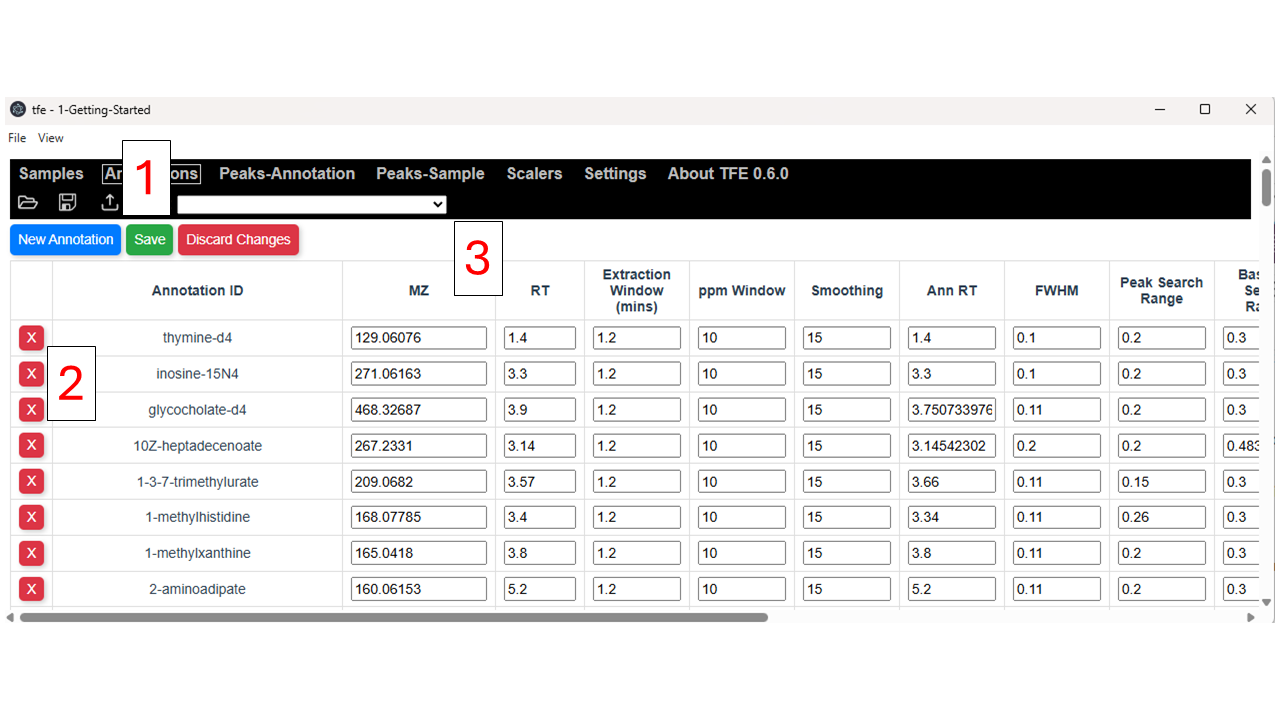 Click the “Create/Edit Annotations” button to open the editing view.
- Create New/Save/Discard Changes - Creating a new annotation copies the default settings from the Settings view.
- Delete Annotation - Delete an annotation by clicking the red X button.
Peaks-Annotation
The Peaks-Annotation view contains the XICs and peak visualization window for viewing integrations. The Up and Down arrow keys change the selected annotation. This is likely the most useful view.
- Press “`” (backtick) to scroll to the selected annotation and sample.
- Press “p” to toggle between table and chart mode.
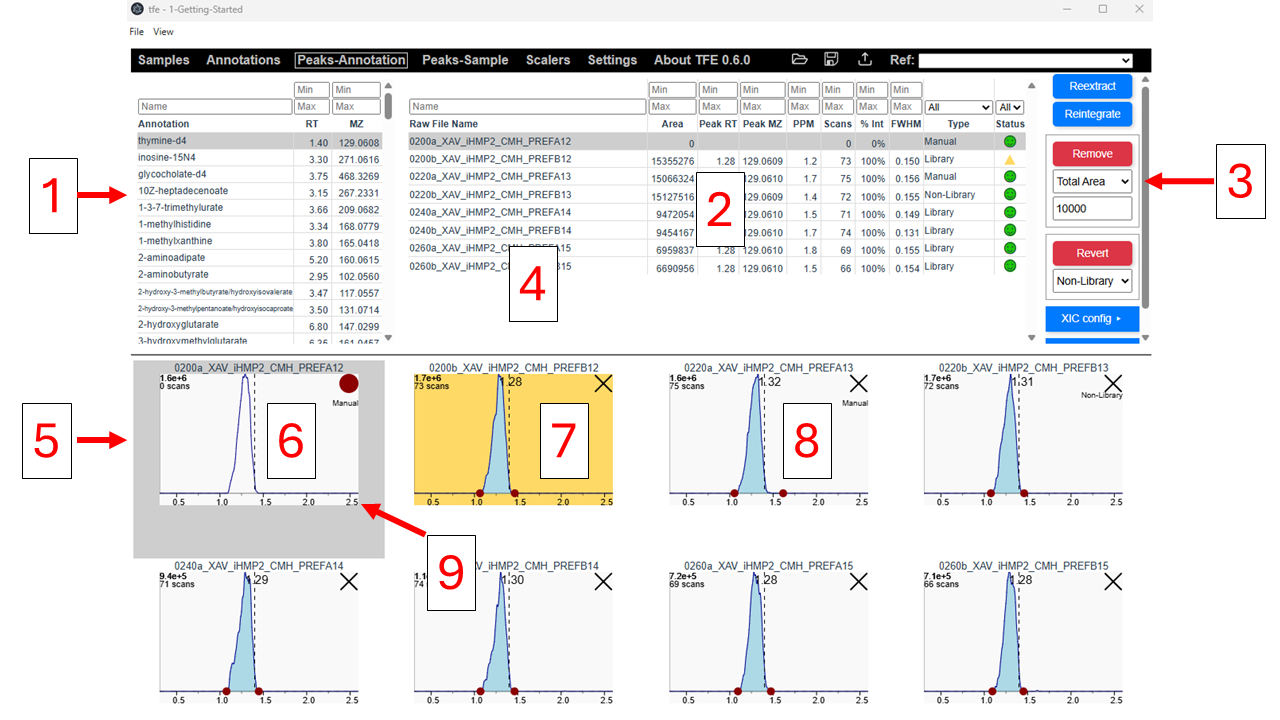
- Annotation List - You may sort and search this table. The selected annotation is highlighted in gray.
- Sample List - Contains the samples and peak metadata. You can sort and search the table, hide or show columns by right-clicking on the table, or adjust the display in the Settings view. The columns are:
- Raw File Name - The name of the sample, minus the extension.
- Area - Total integrated area.
- Peak RT - Measured peak apex RT.
- Peak MZ - Measured MZ, calculated as a weighted average of the MZs within the XIC and integration bounds.
- PPM - Delta PPM of the measured MZ. Positive means the measured peak MZ is higher than expected; negative means it is lower than expected.
- Scans - The number of scans > 0 present in the integration bounds of the unsmoothed data. This is useful when smoothing obscures low signal and makes low-signal peaks appear as smooth Gaussian peaks.
- % Int - The percentage of signal in the integration window that is integrated.
- FWHM - Measured peak FWHM.
- Height - Apex height.
- Width - Width of the peak, defined by the integration bounds.
- Type - Source of the integration parameters: Library (Apply to All), Non-Library (Apply to One), or Manual (Manually Adjusted or Cleared).
- Status
- Side Toolbar - Contains buttons for:
- Reextract
- Reintegrate
- Remove - Clear peaks that satisfy a condition.
- Revert - Revert peaks to their standard library parameters.
- XIC Config - Configure zooming on XICs.
- Show Chart - Toggle between Table and Chart. This can also be done by pressing “p”.
- Center Divider - Click and drag to resize.
- XIC Chart Area - Contains the XICs for each sample. The selected XIC is highlighted in gray. Shortcuts for updating parameters and zooming include:
- Double Click - Open Popup Chart
- Shift + Click - Select Multiple Charts
- Shift + Drag - Zoom
- Shift + Double Click - Reset Zoom
- Alt + Click - Set to Non-Library and update Annotation RT
- Alt + Drag - Draw Manual Integration
- Alt + Shift + Click - Update Annotation RT for all samples and reintegrate
- Alt + Shift + Drag - Set integration bounds for all samples and reintegrate
You may click and drag the integration dots to change a manual integration. You may click the red X in the top-right corner to clear the annotation.
- A cleared XIC. Click the red circle to restore it to the library version.
- An XIC that needs to be reintegrated.
- A manually adjusted integration, indicated by “Manual”. Clear and restore it to revert to the library version.
- Resize XICs by clicking and dragging the bottom-right corner of a chart area. You may also adjust this in the Settings page.
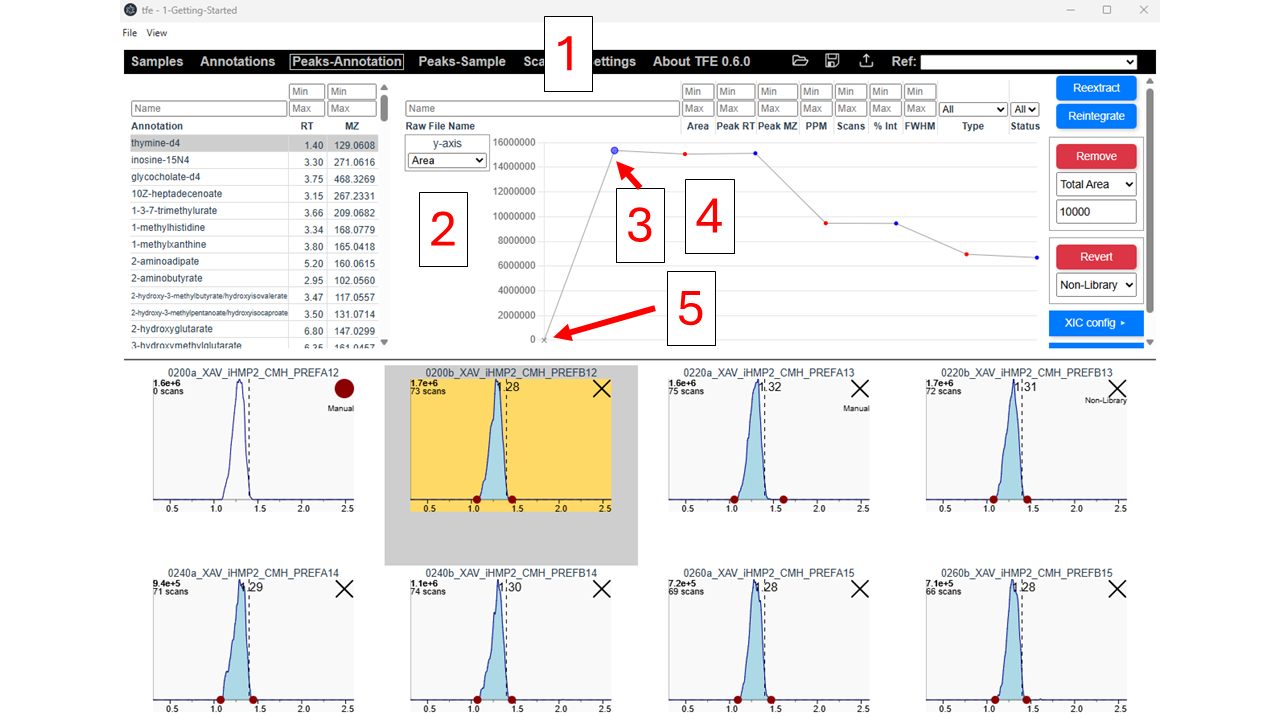
This is the Peaks-Annotation page with a sample profile chart. Sample colors can be customized on the Settings page. By default, filenames containing “prefa” are red and filenames containing “prefb” are blue. Other samples are gray. Missing values and zeroes are plotted as red X’s on the X-axis, or as gray X’s if they are cleared.
- Table Header - Still present and can be used to sort and filter.
- Peak Metadata Dropdown - Select which metric you would like to view.
- Selected Sample - Appears as a larger dot.
- Plot Area
- Cleared Sample
Peaks-Sample
The Peaks-Sample page is very similar to Peaks-Annotation, except raw files are shown in the left table and different annotations are plotted.
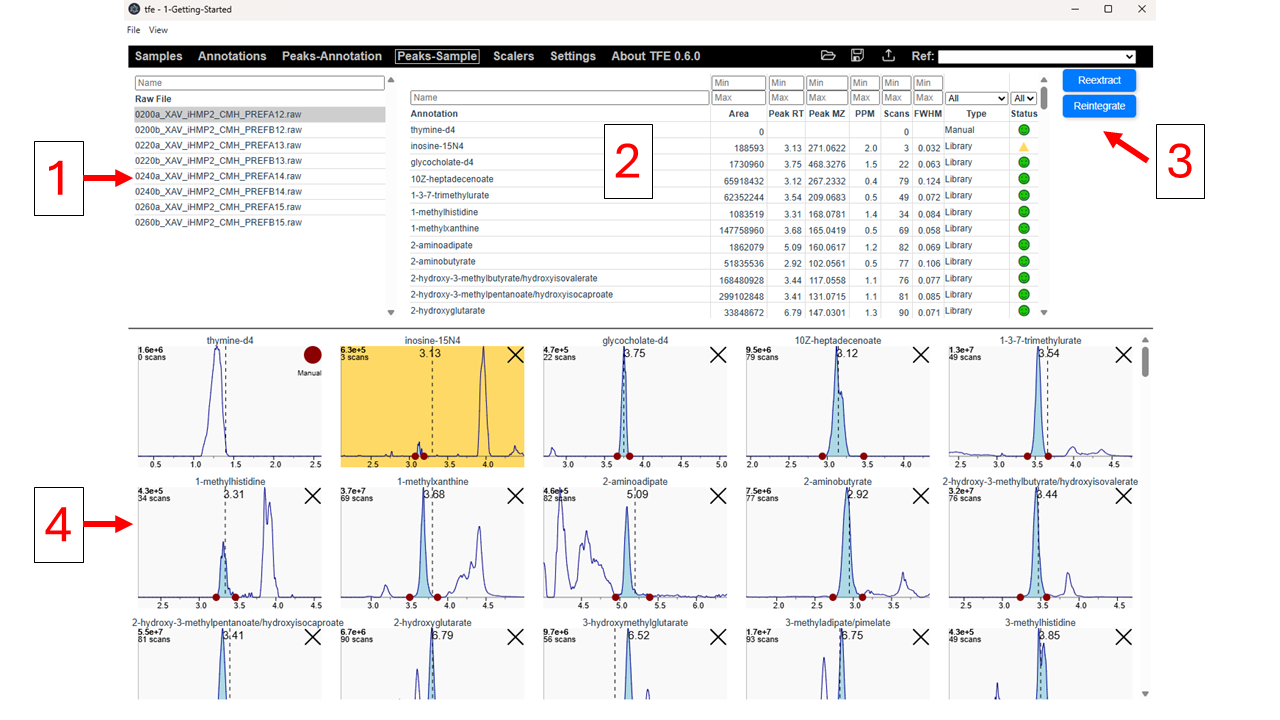
- Sample List
- Annotation List
- Side Toolbar
- XIC Chart Area
Scalers
Thar be dragons here.
Settings
TFE settings can be configured here. They are saved on your computer in your OS user profile folder. They include display properties and behavioral settings. This section will likely grow over time, so you may need to scroll through it.
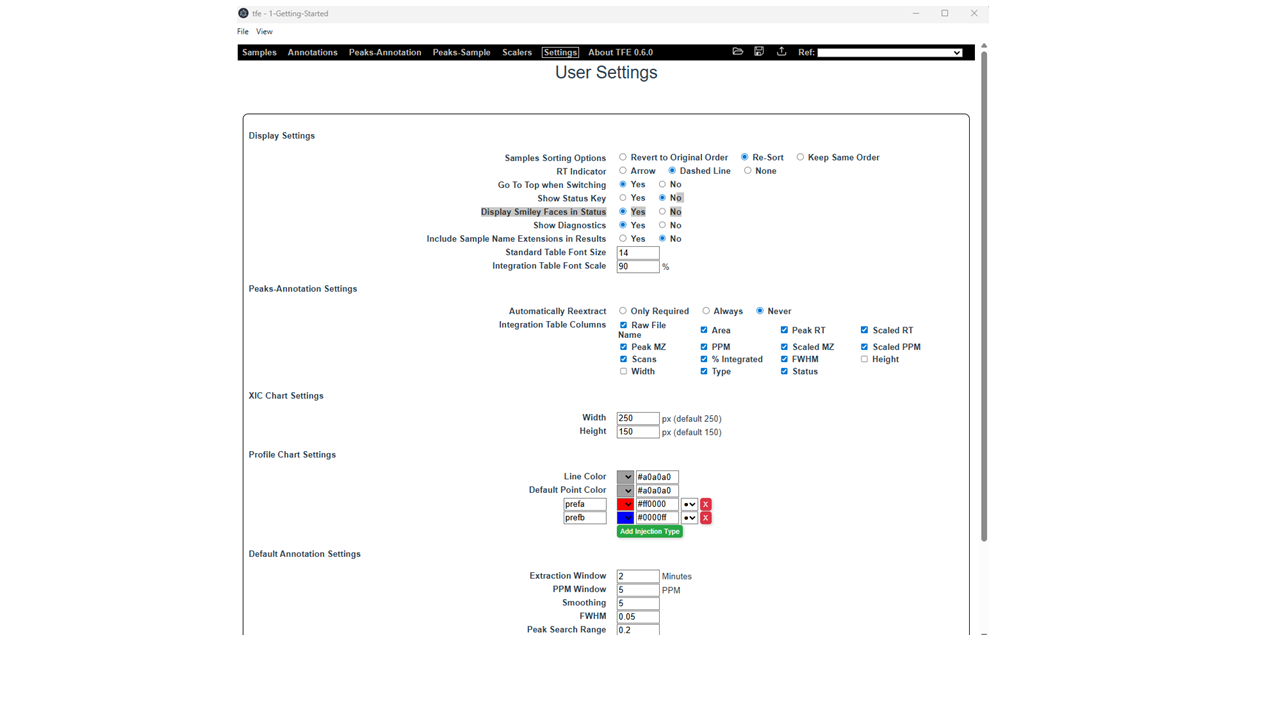
Display Settings
- Sample Sorting Options - When switching annotations in the Peaks-Annotation page, you can control how the Sample Table is sorted. You may revert to the original order, re-sort based on the selected sort option, or keep the exact same order.
- RT Indicator - Controls how the annotation RT is shown on the XIC charts: dashed line, arrow, or none.
- Go To Top When Switching - When switching annotations in the Peaks-Annotation page, you may stay on the selected sample or go to the top of the sample list, depending on the Sample Sorting Option.
- Show Status Key - Displays a status key in the Peaks-Annotation view.
- Display Smiley Faces in Status - Important: makes the green status a smiley face instead of a dot.
- Show Diagnostics - Displays diagnostic markers in the Popup Chart by default.
- Include Sample Name Extensions in Results - Includes or excludes file extensions, such as .raw and .mzml, in the results files.
- Standard Table Font Size - Text size in the Annotations page.
- Integration Table Font Scale - Text size in the Peaks-Annotation and Peaks-Sample tables.
Peaks-Annotation Settings
- Automatically Reextract - When extraction settings are changed in the Popup Chart, this controls whether reextraction happens automatically (
Always), only when required (Only Required), or never (Never). If you have >100 samples, you may want to set this toNeverto avoid unintentionally triggering long extractions. - Integration Table Columns - Controls the default display of table columns in the Peaks-Annotation view.
XIC Chart Settings
This section controls the height and width of the XIC charts on the Peaks-Annotation and Peaks-Sample pages. These can be changed here or by clicking and dragging the bottom-right corner of the charts.
Profile Chart Settings
Options for the Sample Profile Chart on the Peaks-Annotation page.
- Line Color - The line color in the chart.
- Default Point Color - The default color for samples.
Additional injection types are also listed below. You can assign custom colors based on substrings. By default, filenames containing “prefa” are red and filenames containing “prefb” are blue. You may add or delete entries.
Default Annotation Settings
When adding new annotations in the Annotation page, these are the default settings that autopopulate.
About TFE x.x.x
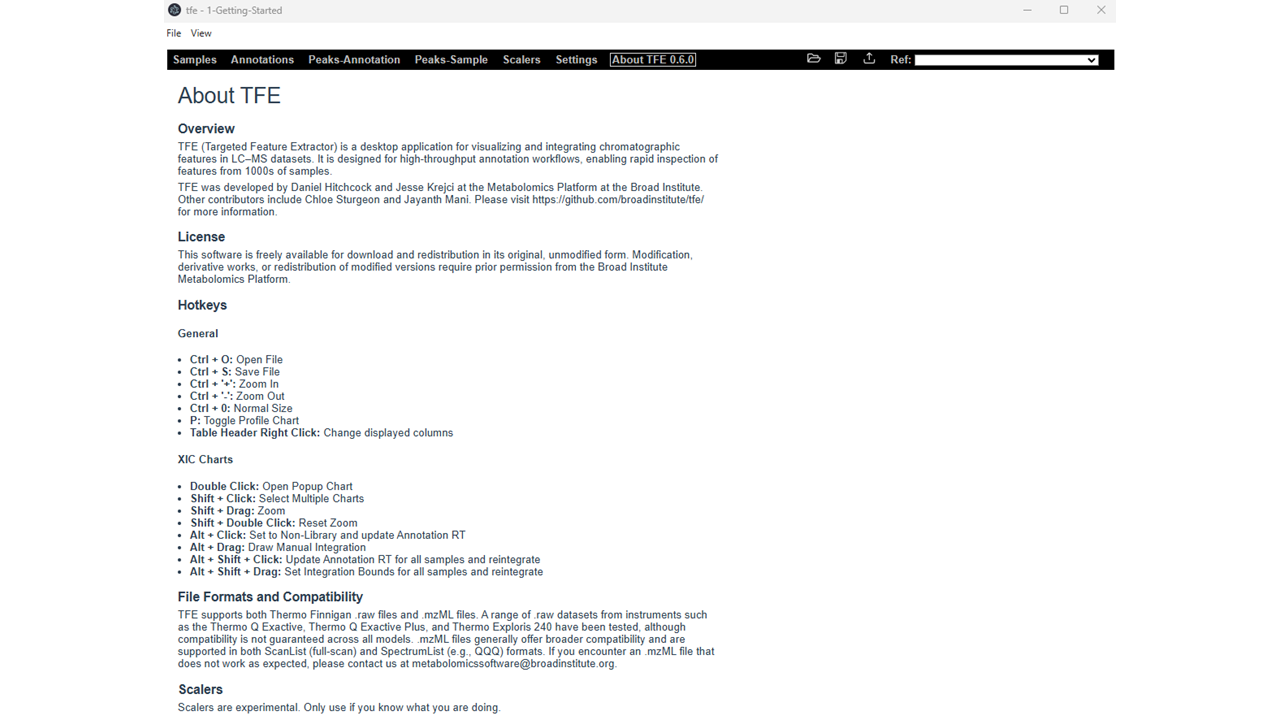
The About page contains licensing information, contributor information, and useful shortcuts.
Popup Chart
The Popup Chart opens when you double-click an XIC. In this window, you can adjust extraction and integration settings and update the annotation.
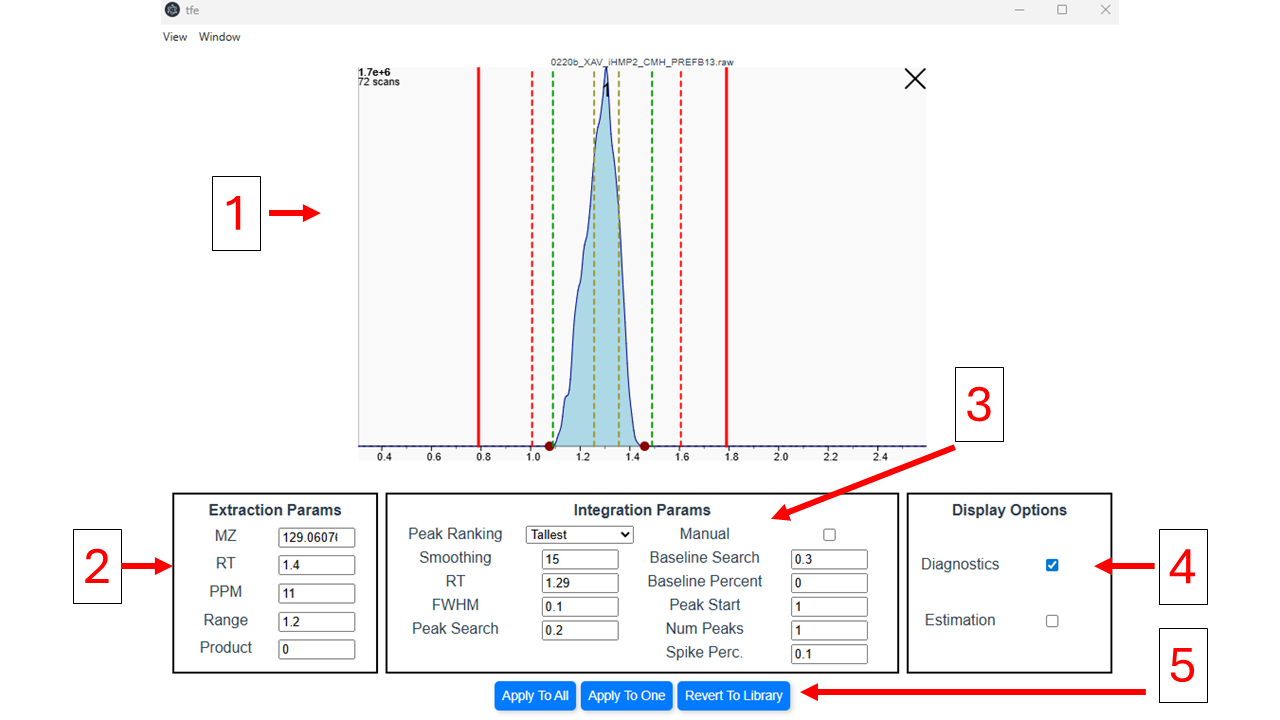
- XIC Window with Diagnostics On - Shows the effect of the integration settings in real time. Diagnostic lines are also displayed to help fine-tune annotations.
- XIC - The full XIC determined by the extraction parameters.
- Number at Top - The detected peaks in priority order, with 1 being the highest priority.
- Dashed Green Line - The search range used to find peaks. It is determined by the integration RT ± peak search.
- Dashed Yellow Line - The specified FWHM, centered on the selected peak(s). Integration will not stop within these bounds. This is determined by the FWHM and selected peaks.
- Red Dashed Line - The peak integration stop window. Integration bounds cannot extend beyond this line. This is determined by the detected peak RT(s) and the baseline search.
- Solid Red Line - The required region of the XIC. If these lines extend beyond the bounds of the XIC, the chart turns bright red, indicating that the integration parameters are not compatible with the extraction parameters. These lines are determined by the annotation RT ± (peak search + baseline search).
- Extraction Parameters - The range of the cached XIC.
- Integration Parameters - Peak detection and integration settings.
- Display Options - Hide or show the diagnostics or estimation line.
- Action Buttons - Apply settings to one sample, apply settings to all samples, or revert settings back to the library settings.