Getting Started
Before starting, please review the Supported Files and Projects page
1. Create a Project Directory
To start a new TFE project, create a new folder for the project and move all LC-MS raw data files into that directory. Example raw files from iHMP2 can be found here: IHMP2 Example Folder
2. Create or Copy annotations.csv
Next, create or copy an annotations.csv file into the project directory.
An example annotations.csv file is available here: annotations.csv
This file contains example annotations for peaks acquired using a 12-minute Orbitrap gradient.
If this is your first time using TFE with a particular chromatography method, some parameters may initially require estimation. These parameters can be refined during manual review in TFE and reused in future projects.
For a detailed explanation of the extraction and integration algorithms, see Extraction, Integration, and Status.
3. Update the most relevant annotation parameters
If you are modifying or adding new annotations, be sure to update the feature identifiers. The most important annotation fields are:
mz— target m/z valuert— extraction center retention timeextraction_window— visible extraction range around the RTppm_window— mass tolerance window (~10 ppmfor Orbitrap systems,~50 ppmfor TOF systems)annRt— expected annotation peak retention time
Additional annotations can later be added by:
- editing
annotations.csvwhile TFE is closed - creating new annotations directly within TFE
4. Launch TFE and Open the Project
Download TFE from the releases page.
Launch the tfe executable downloaded from this repository. Depending on your operating system, you may receive warnings related to unsigned software. If the download source is trusted, continue past these warnings.
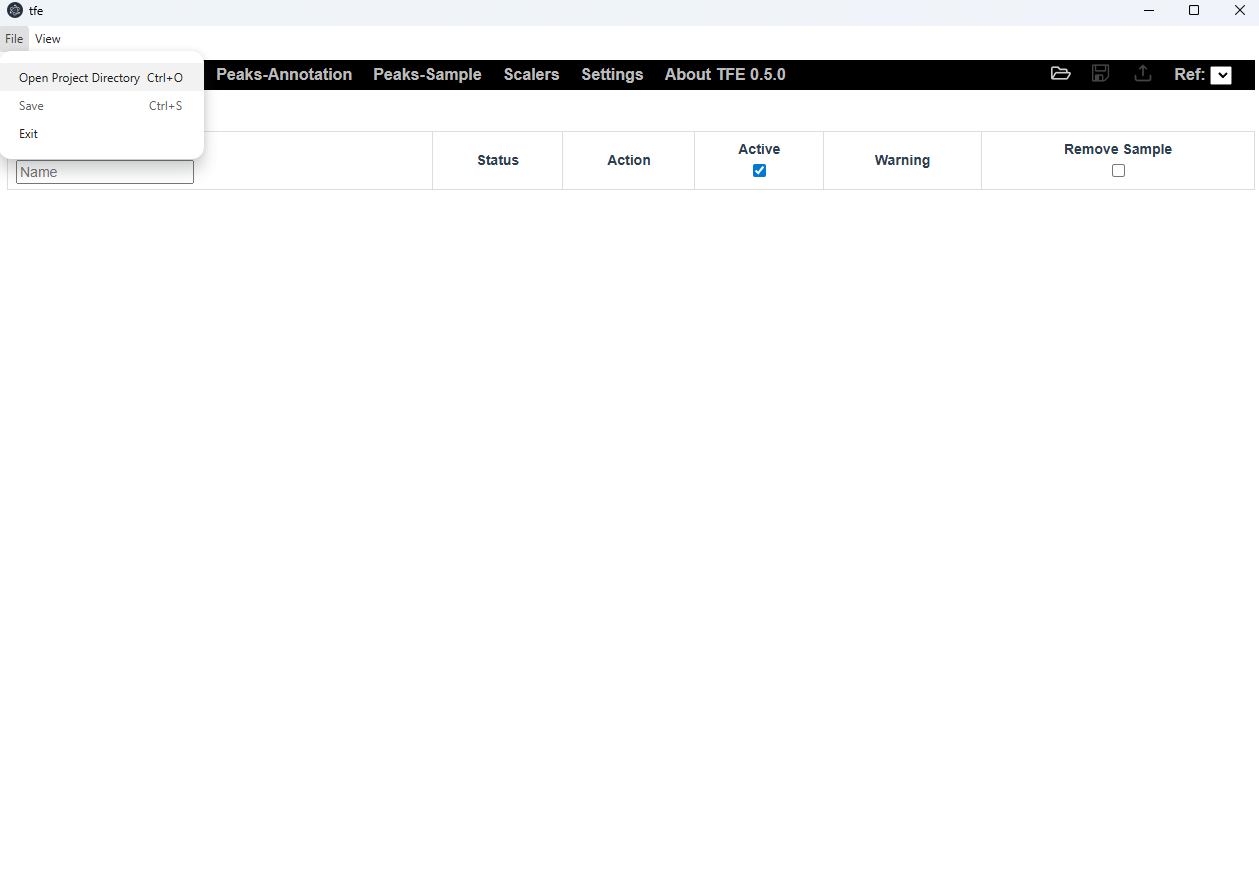
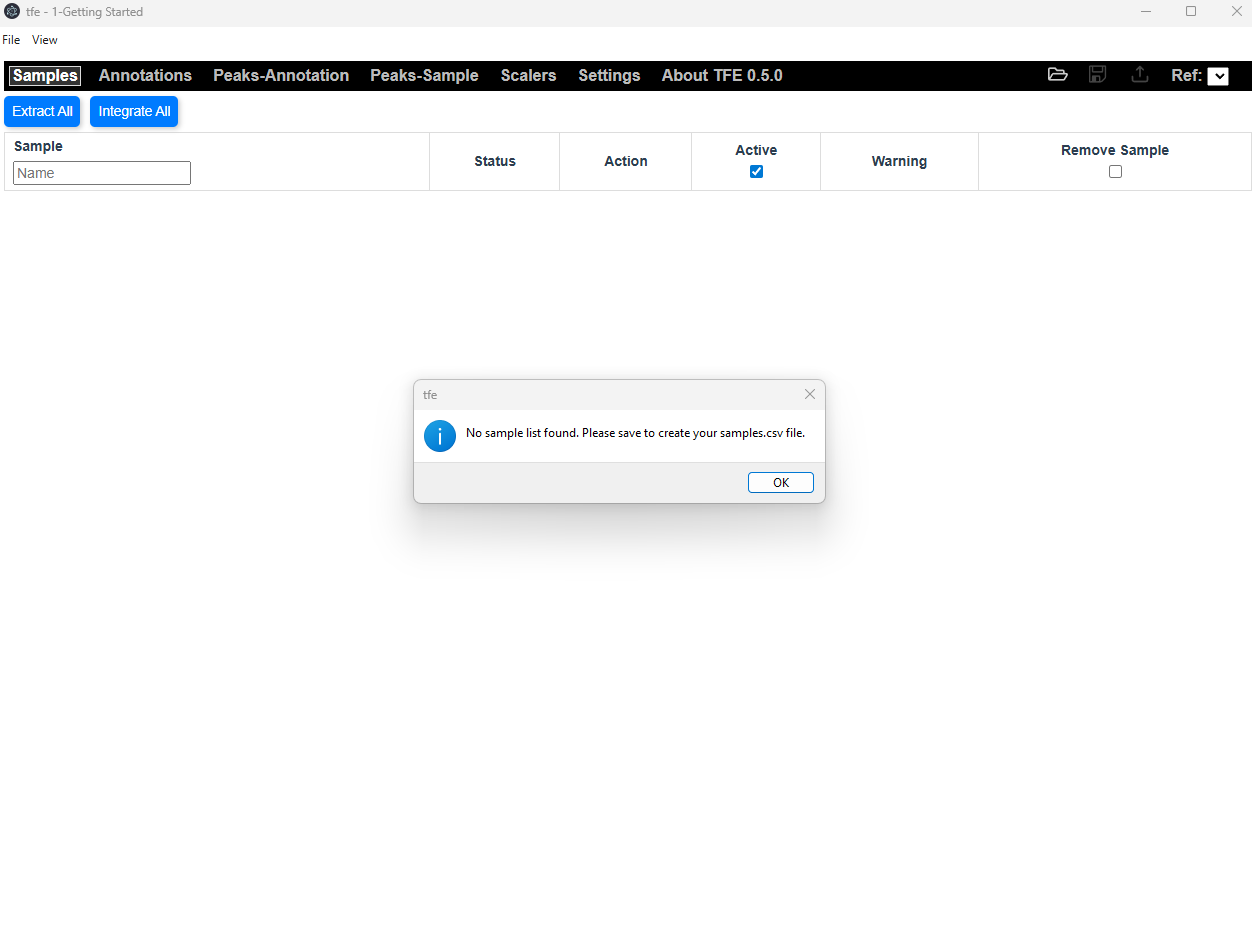
Select File->Open Project Directory and navigate to your folder. You should receive notifications that it is creating a sample list, samples.csv.
5. Extract XICs
After opening, the sample list will appear. This view is the Samples Page.
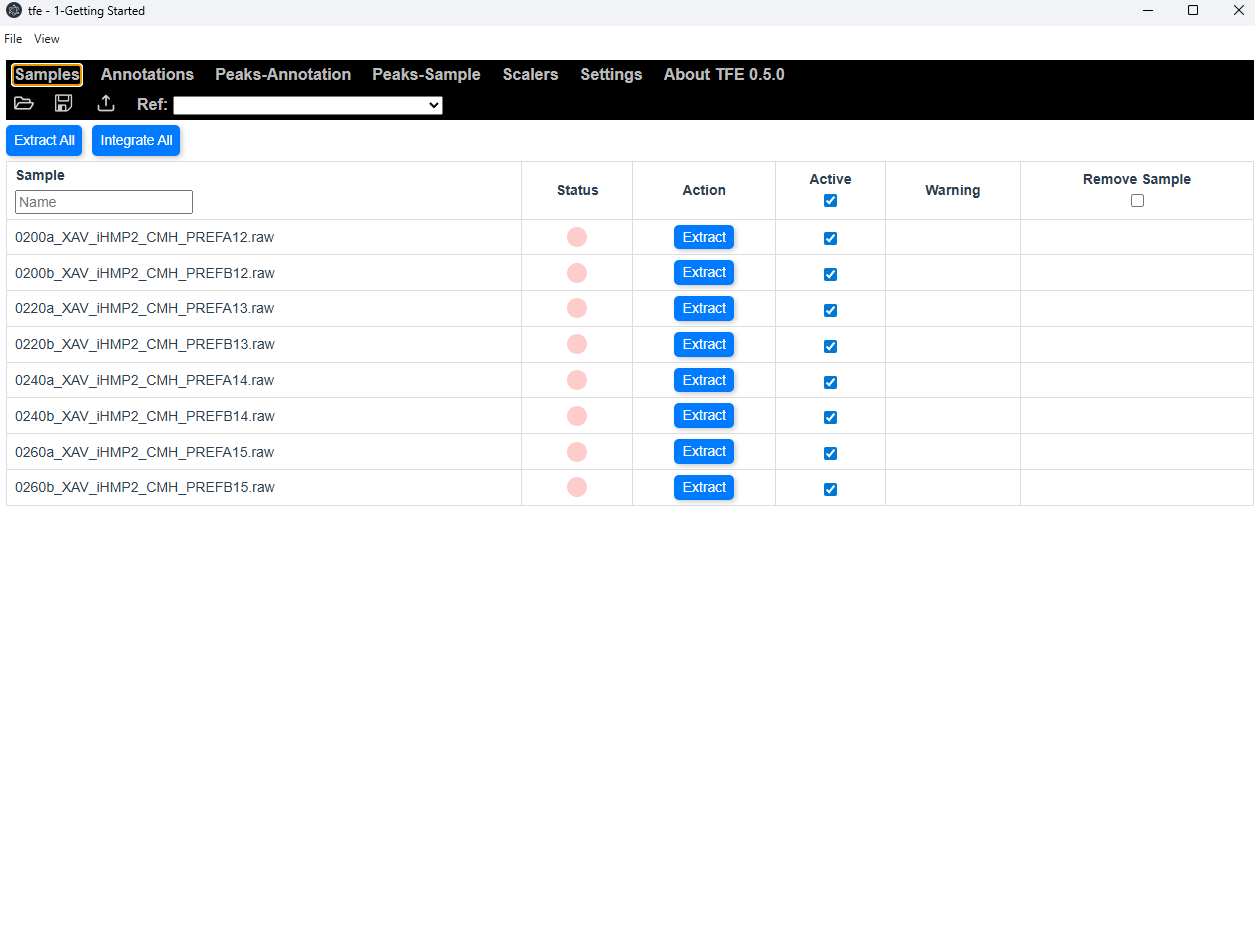
Initially, all samples will have a red dot for status, indicating that extraction is required.
Click Extract All.
During extraction, TFE reads chromatographic data from the raw files and generates extracted ion chromatograms (XICs) using the annotation extraction parameters (mz, rt, extraction_window, and ppm_window).
As long as these extraction parameters remain unchanged, re-extraction is not required. Integration operations are substantially faster than extraction.
For additional details, see Extraction, Integration, and Status.
For a detailed description of the Samples Page, please see Page Descriptions
6. Integrate Peaks
Once extraction is complete, samples will appear in yellow, indicating that integration is required, usually because the parameters have changed.
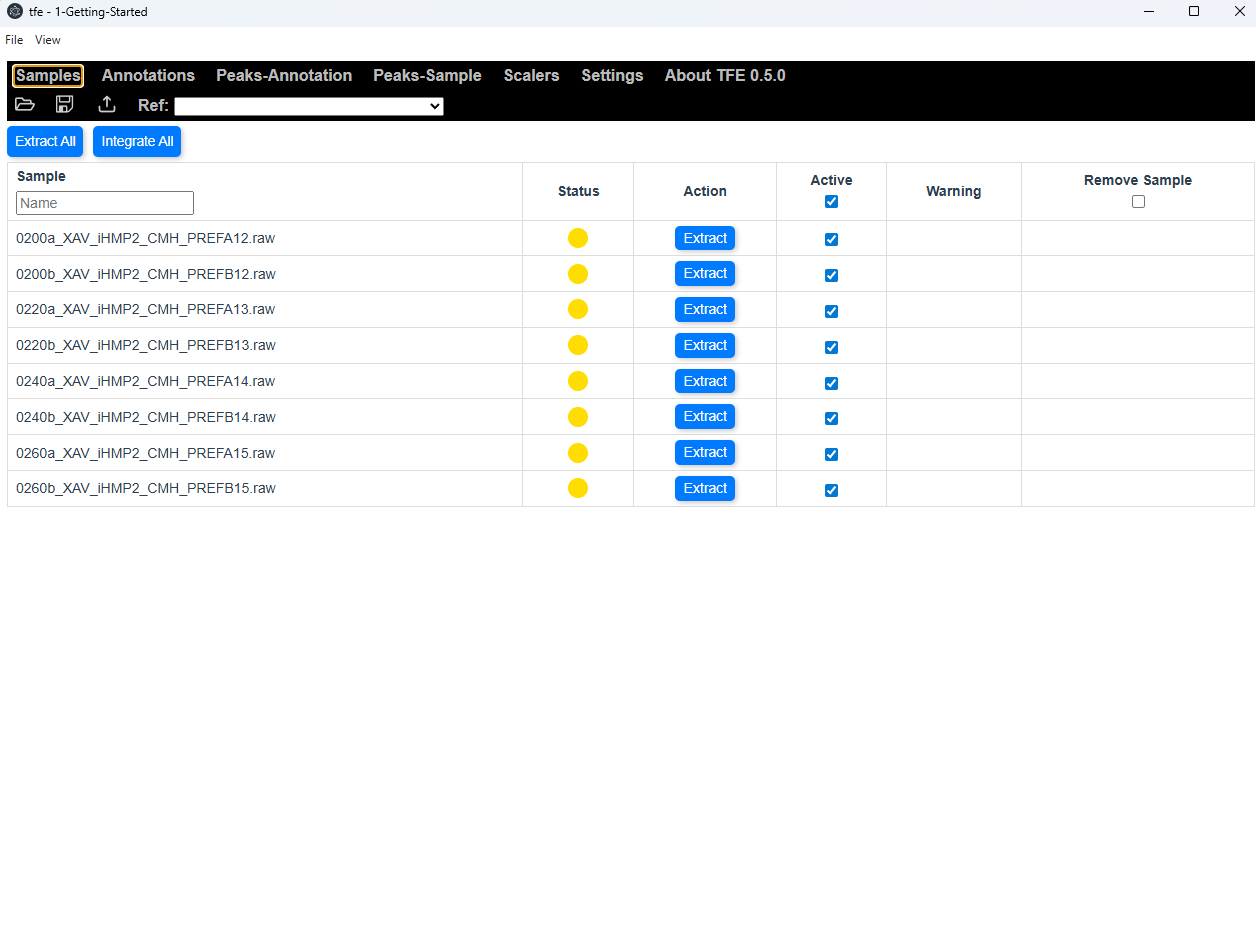
Click Integrate All.
TFE will perform peak integration across the extracted chromatograms. The sample status should now be green, indicated each sample is completely up to date with integrated parameters.
7. Save the Project
Save the project using:
Ctrl + S- or the Save option in the File menu
You will received a notification that saving was successful. This creates an xics.bin file containing the current extracted and integrated project state. Also if you did not have a samples.csv file, it will be created.
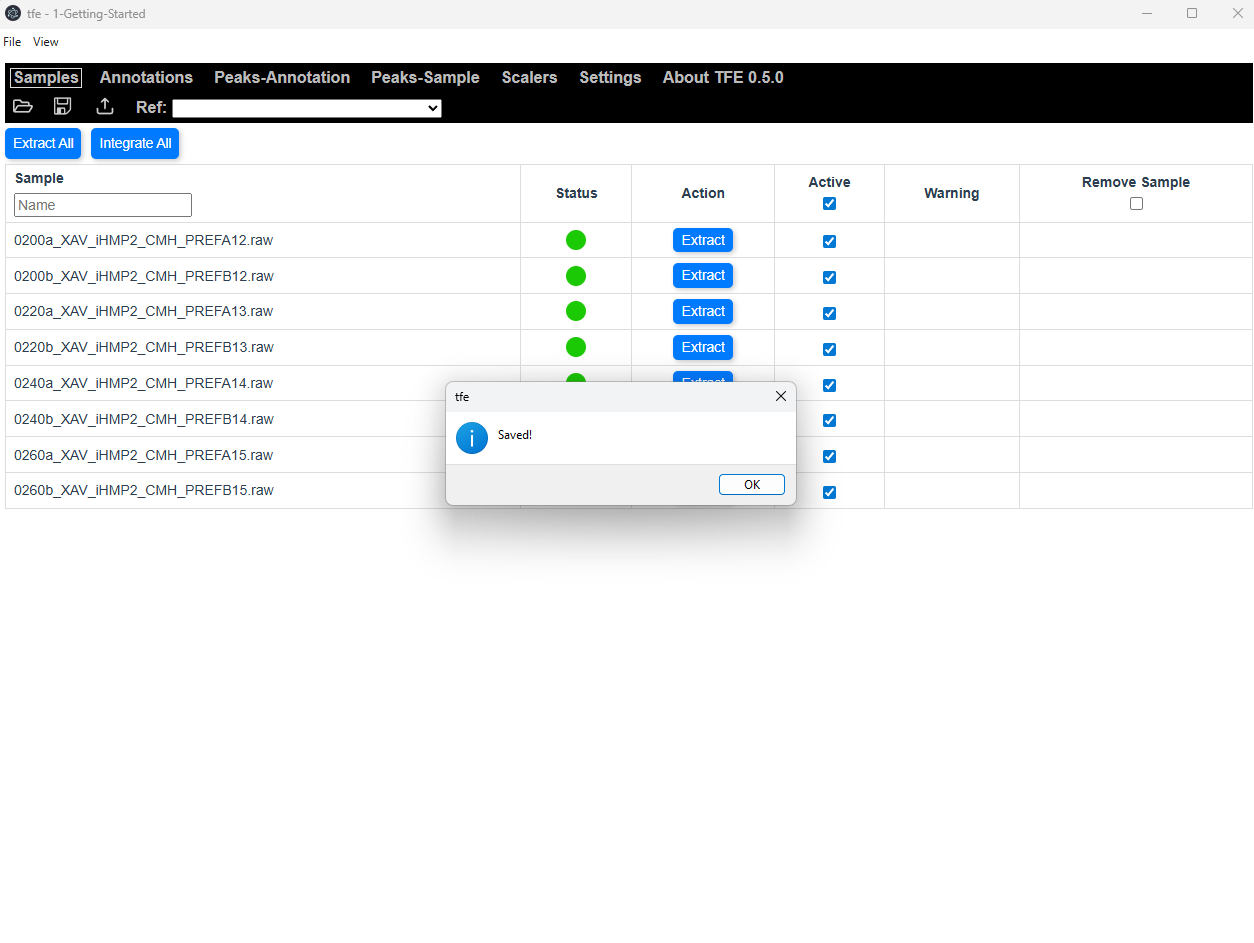
The xics.bin file contains all information required to reopen the project without re-extracting chromatograms and can be backed up or shared with collaborators.
8. View XICs in the Peaks-Annotation Page
Open the Peaks-Annotation page by click on the Peaks-Annotation section on the toolbar. Please see Page Descriptions for a detailed description of the page.
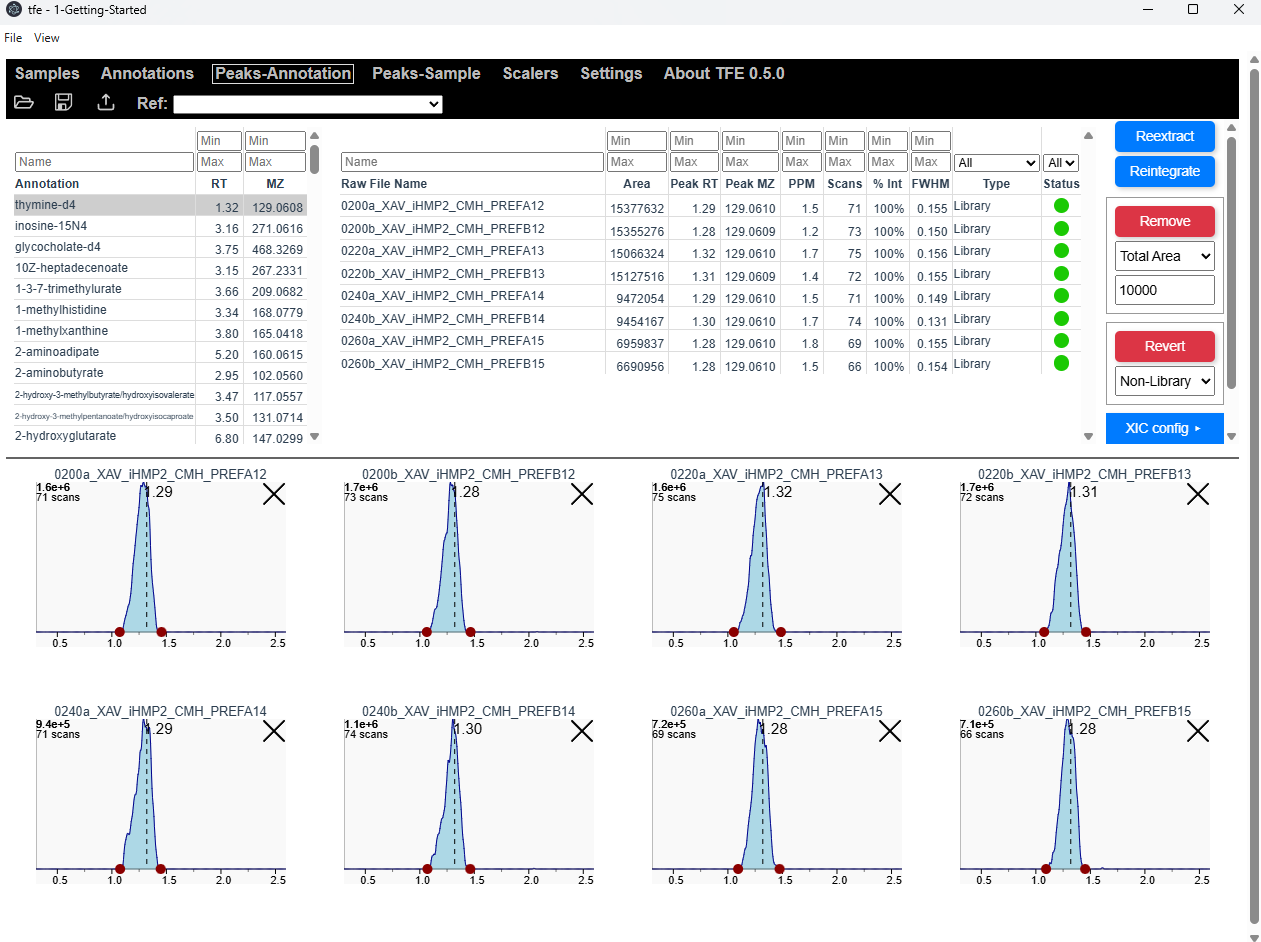
This view will show:
- the annotation list
- extracted ion chromatograms for all samples
- integrated peak information
The lower XIC display area can be resized by dragging the divider between panels. Individual XIC panels can also be resized by dragging the lower-right corner of the XIC squares.
Additional display and interaction settings are available in the Settings page.
The upper-left table contains the annotation list.
- Use the arrow keys to move between annotations.
- Tables can be sorted and filtered using the search fields.
The upper-center main table contains per-sample integration results.
- Columns can be shown or hidden by right-clicking column headers.
- Tables can be sorted and filtered.
- Clicking a sample row or chromatogram will scroll to that sample.
- Pressing the backtick key (`) focuses the display on selected samples.
9. Open the Sample Profile Chart
Press P or click Show Chart in the upper-right toolbar to open the sample profile chart. If the window is small, you may have to scroll down to find the Show Chart button.
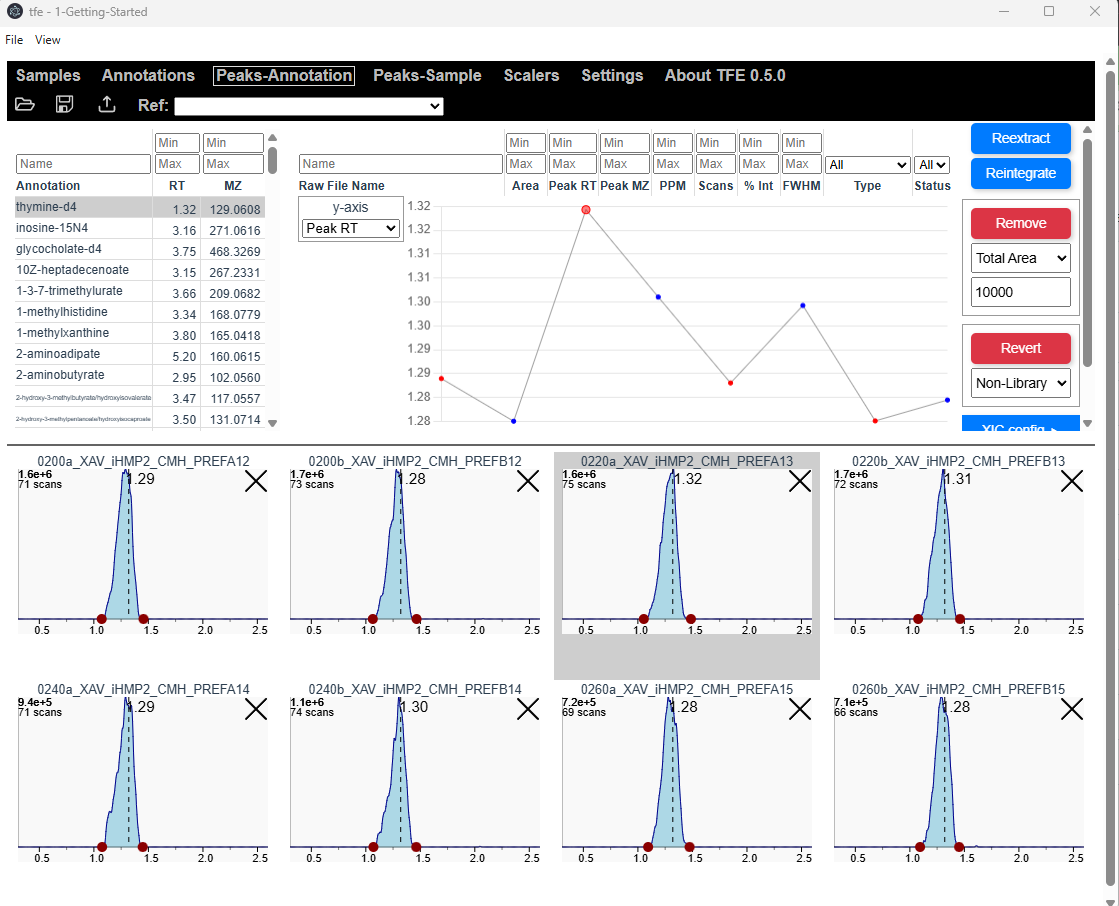 This view allows visualization of selected metrics across samples.
- Select metrics using the dropdown menu.
- Clicking a point will navigate to the corresponding feature in the XIC display.
- Chart colors can be customized in the Settings page.
10. Adjust Integrations from the Main View
When using TFE, you are often expected to scroll through every annotatoin and verify the integrations are successful. Integrations can be modified directly from the XIC display.
Available Actions
- Remove an integration using the
Xbutton in the chart corner - Restore an integration to default by clicking the
Othat appears in a cleared annotation - Adjust integration boundaries by dragging the red integration dots
- Create entirely new integration regions using
Alt + Click + Drag
Retention Time Adjustments
Alt + Click— adjust RT for a single sampleShift + Alt + Click— adjust RT for all samplesShift + Alt + Click + Drag— define a new integration region for all samples
If a plot turns red, the integration parameters are incompatible with the extraction parameters, usually because the requested integration region falls outside the extracted range.
For additional details, see Extraction, Integration, and Status.
11. Open the Popup Chart for Detailed Review
Double-click an XIC to open the Popup Chart in a new window.
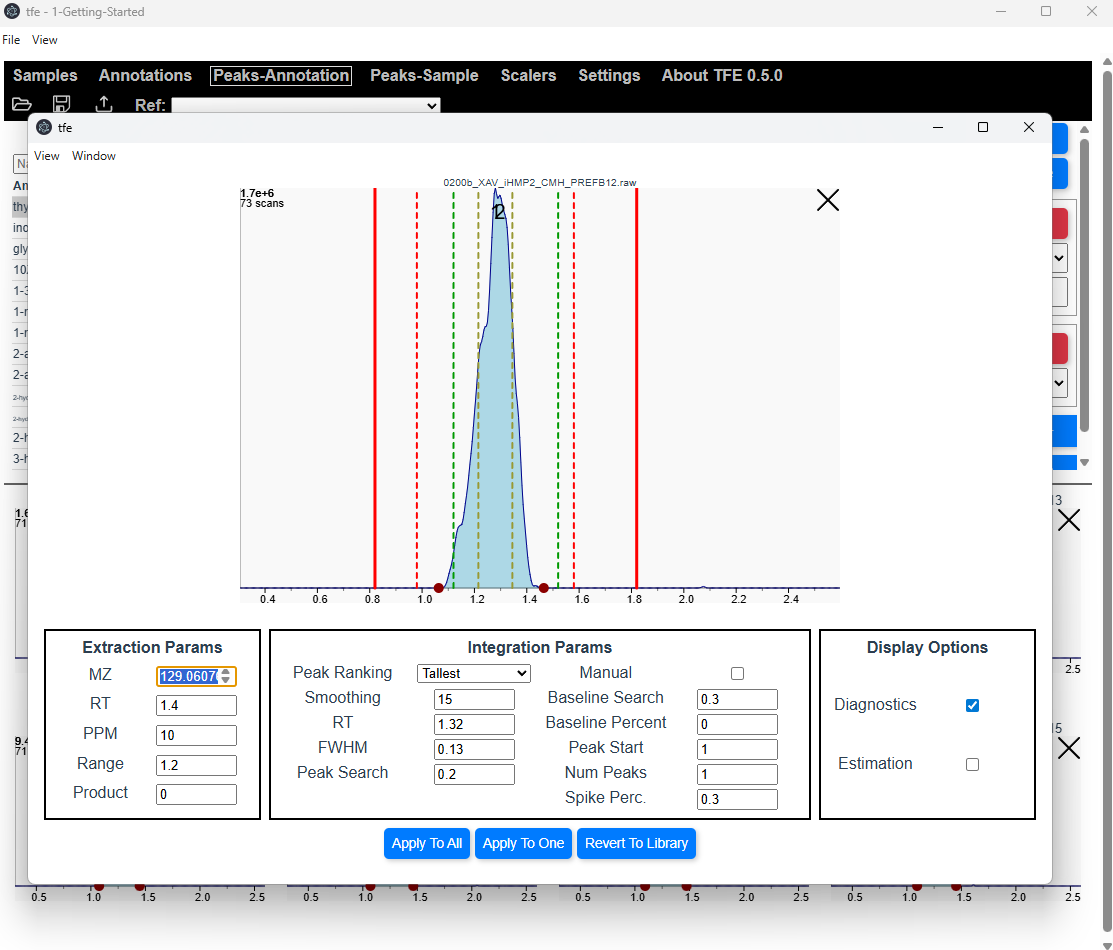 This interface allows more detailed inspection and editing of extraction and integration parameters.
Try checking/unchecking the diagnostics checkbox. This controls the display of helpful lines in the XIC to find tune annotations.
- Dashed Yellow Line - The specified FWHM (for one peak) or the left FWHM from the leftmost peak and right FWHM right the rightmost peak.
- Dashed Green Line - The peak search range
- Dashed Red Line - The integration stop range, determined from the detected peaks +/- the
baseline_search - Solid Red Line - This is the portion of the XIC that is required for the integration params, determined by
annRT+/- (baseline_search+peak_search). If this line goes outside the xic extraction params, the chart will turn bright red, indicating that the annotation params are not compatible with the extraction params.
Try making some changes, then you can apply them to:
- a single sample
- selected samples (select by shift-clicking on the main window)
- all samples
Please see Page Descriptions for a detailed description of the Popup Chart.
12. Export Data
A feature abundance table can be exported. First, select a reference sample by clicking the dropdown next to Ref: – the reported m/z and retention time will be scaled to this sample.
Next, click on the Export icon next to it. This will create the following files in the directory:
results-abundances.csv- main results file with abundancesresults-mzs.csv- measured m/zsresults-ppms.csv- measured delta PPMsresults-rts.csv- measured retention timesresults-samples.csv- rawfile metadata for each sample. Currently only contains the date
13. Sharing Projects
The xics.bin file contains everything needed to share the project and is saved in the project directory. A user can open the xics.bin without rawfiles or annotations/samples.csv, however, they cannot reextract or update the extraction settings without the raw files.
14. Settings View
TFE has several customizable parameters that can find tune display and behavior to your work style. Click on Settings to navigate to the Settings Page. These will be saved on your computer so every time you run TFE, they will be loaded.
Please see Page Descriptions for a detailed description of the Popup Chart.