Getting Started
Figure 1
To run the access test
1. visit https://broad.io/cb-python-access-test
2. click “Copy to Drive” and create your own copy of
Python_workshop_data_access_test.ipynb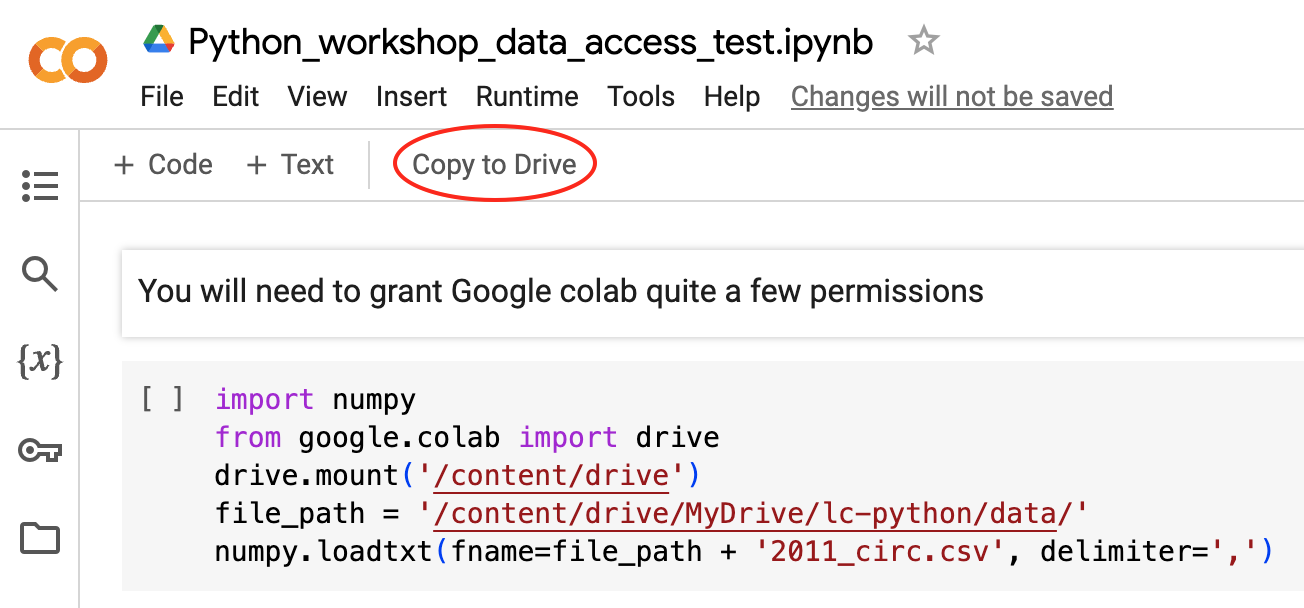
Figure 2
If you see this dialog box, click “Connect to Google Drive” 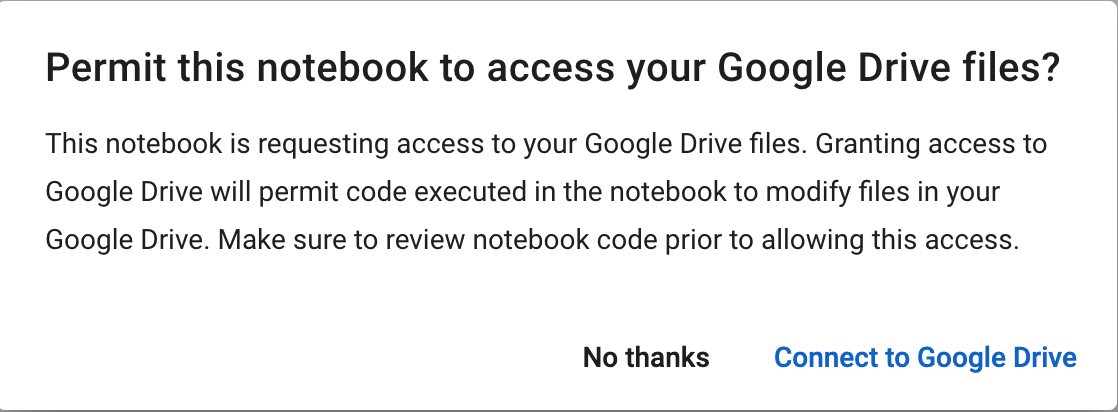
Figure 3
Authorize access for the google account you’re using for this
workshop. There will be several prompts to grant access. 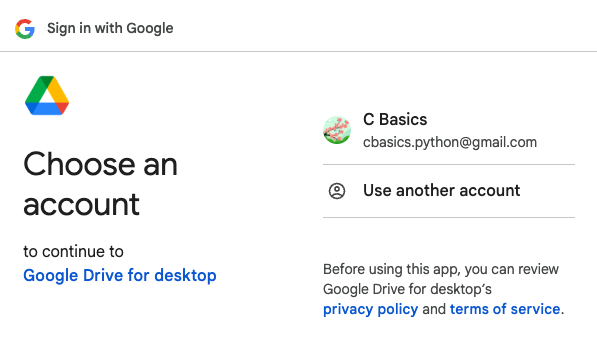 You’ll need to grant
Google all the permissions it requests to make your google drive
accessible to Colab.
You’ll need to grant
Google all the permissions it requests to make your google drive
accessible to Colab.
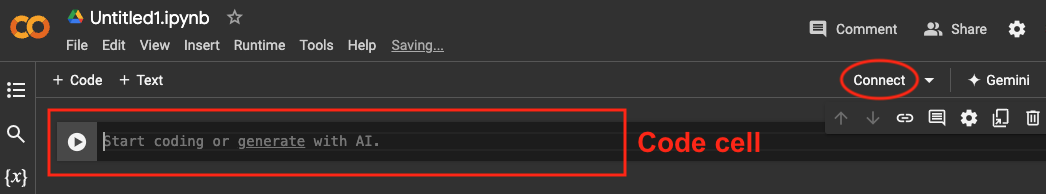
Figure 4
Once access has been granted, go back to the access test
notebook, click the ▶️ symbol on the left hand side of the first code
cell. You’ve successfully loaded data if you see a dataframe appear
beneath the code cell 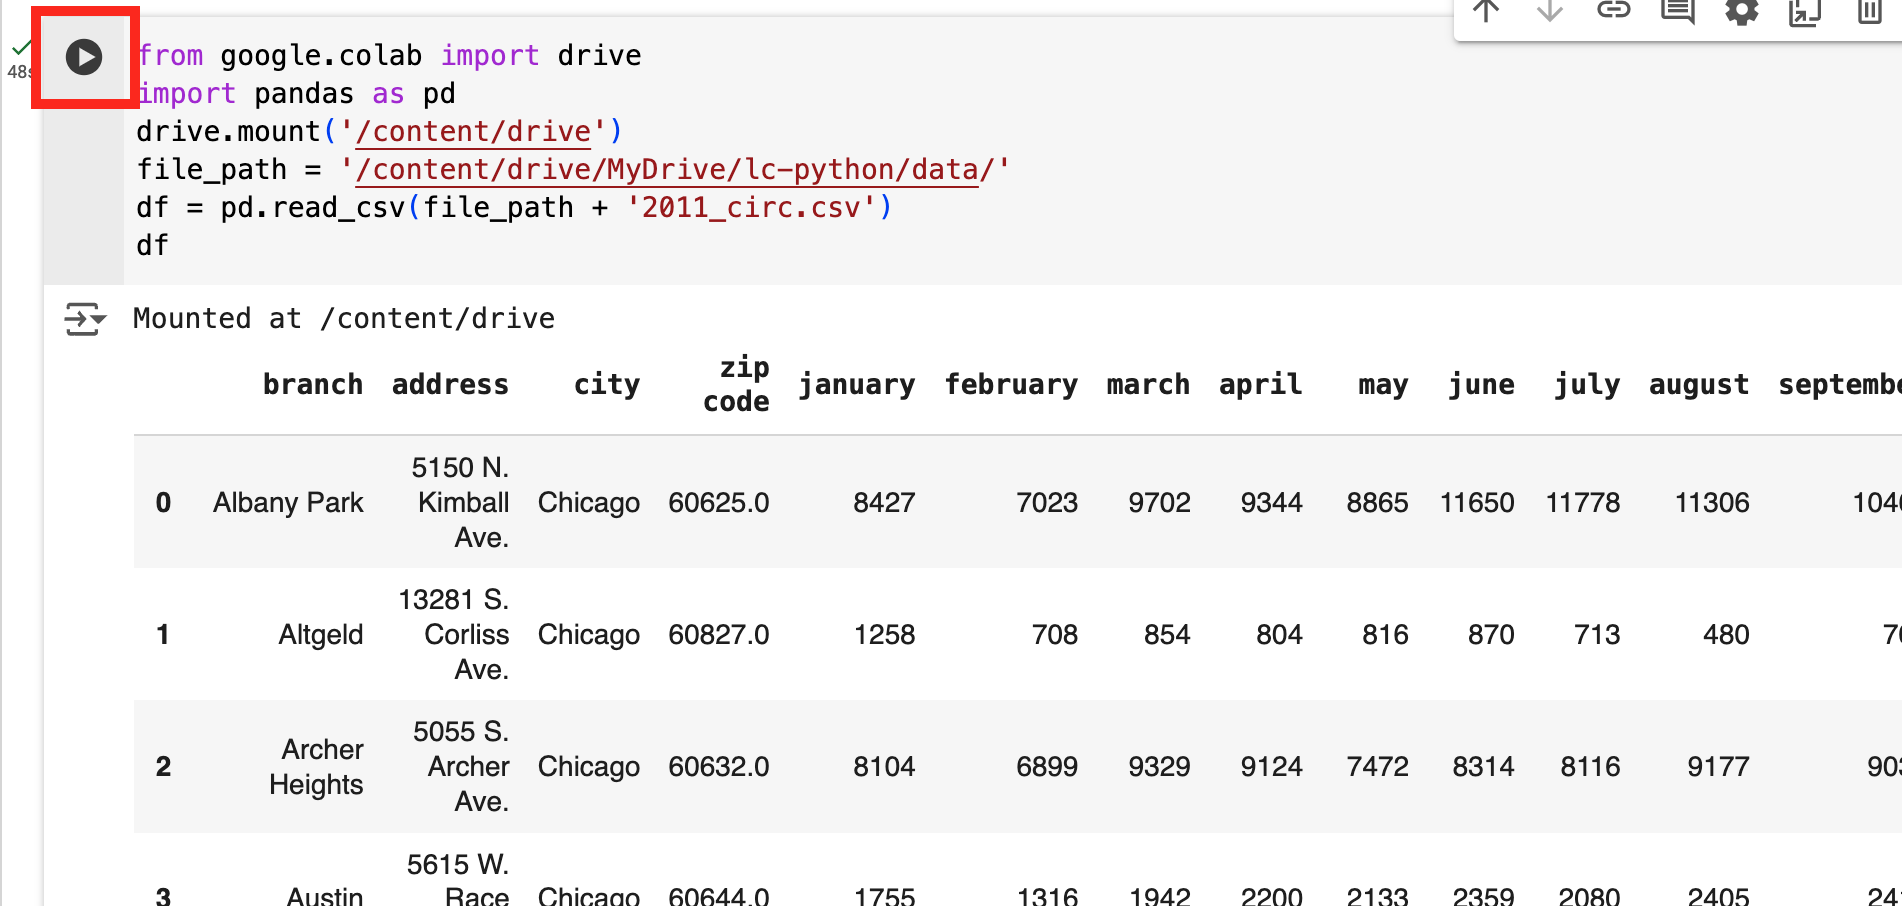
Figure 5

Figure 6
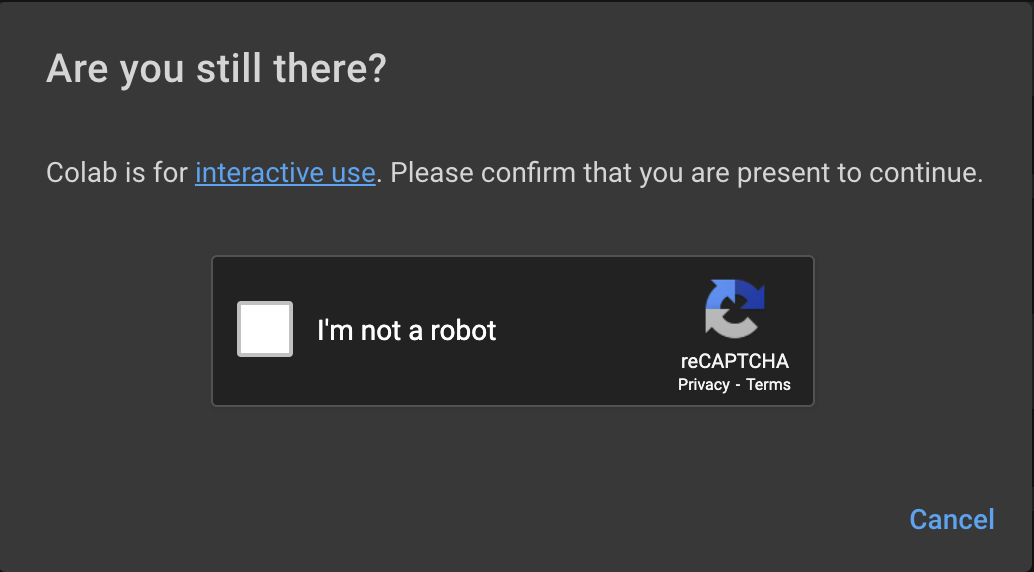
Figure 7
Variables and Types
Lists
Built-in Functions and Help
Libraries & Pandas
For Loops
Figure 1
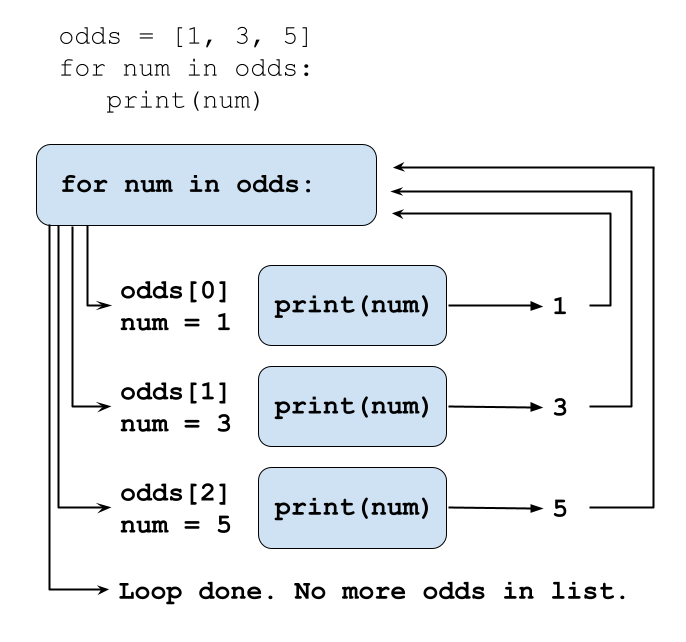
Looping Over Data Sets
Conditionals
Writing Functions
Data Visualisation
Figure 1
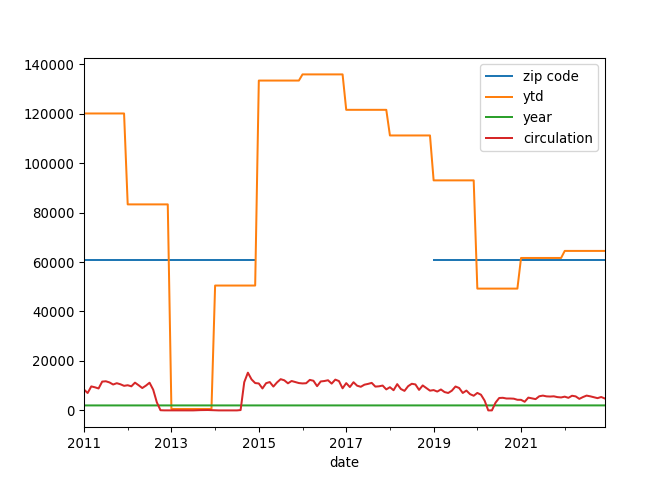
Figure 2
Figure 3
Figure 4
Figure 5
Figure 6
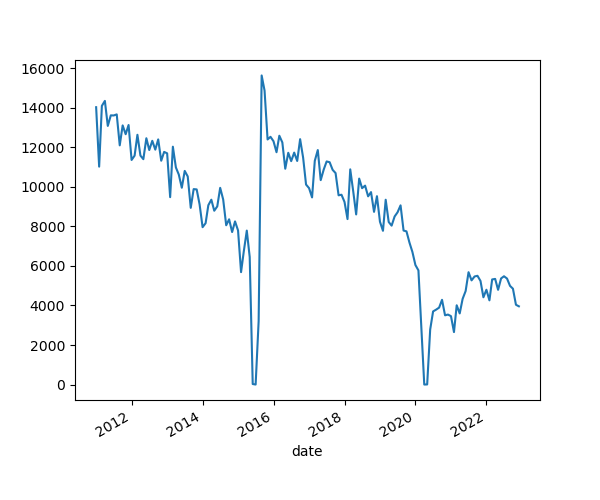
Chinatown plot
Figure 7
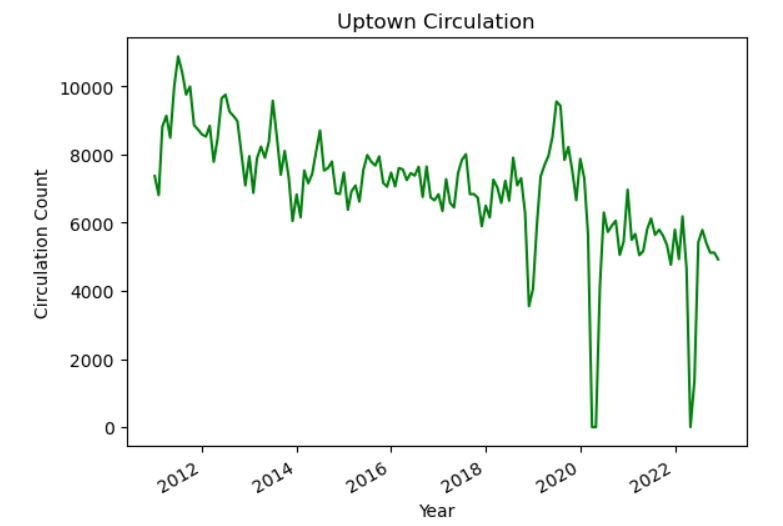
Uptown plot
Figure 8
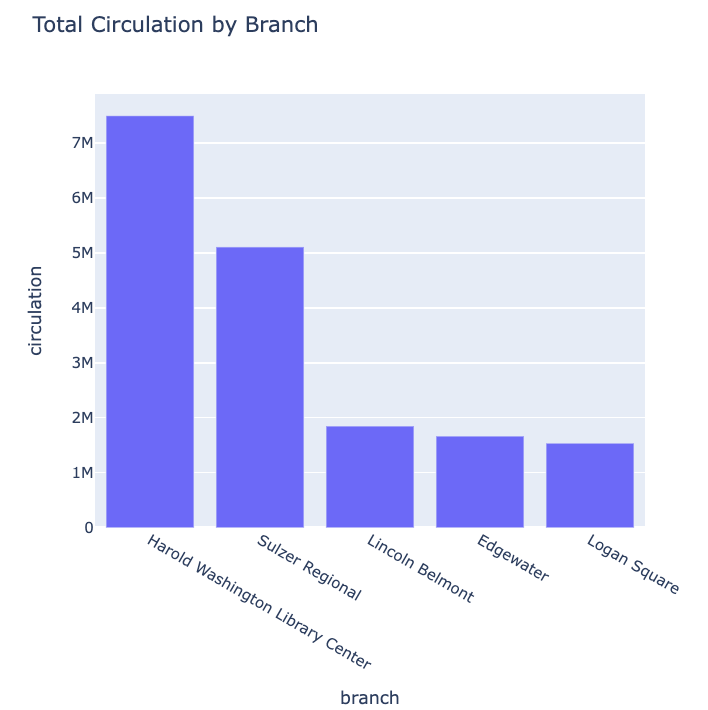
Top five circulation branches
Using Pandas
Tidy Data with Pandas
Figure 1
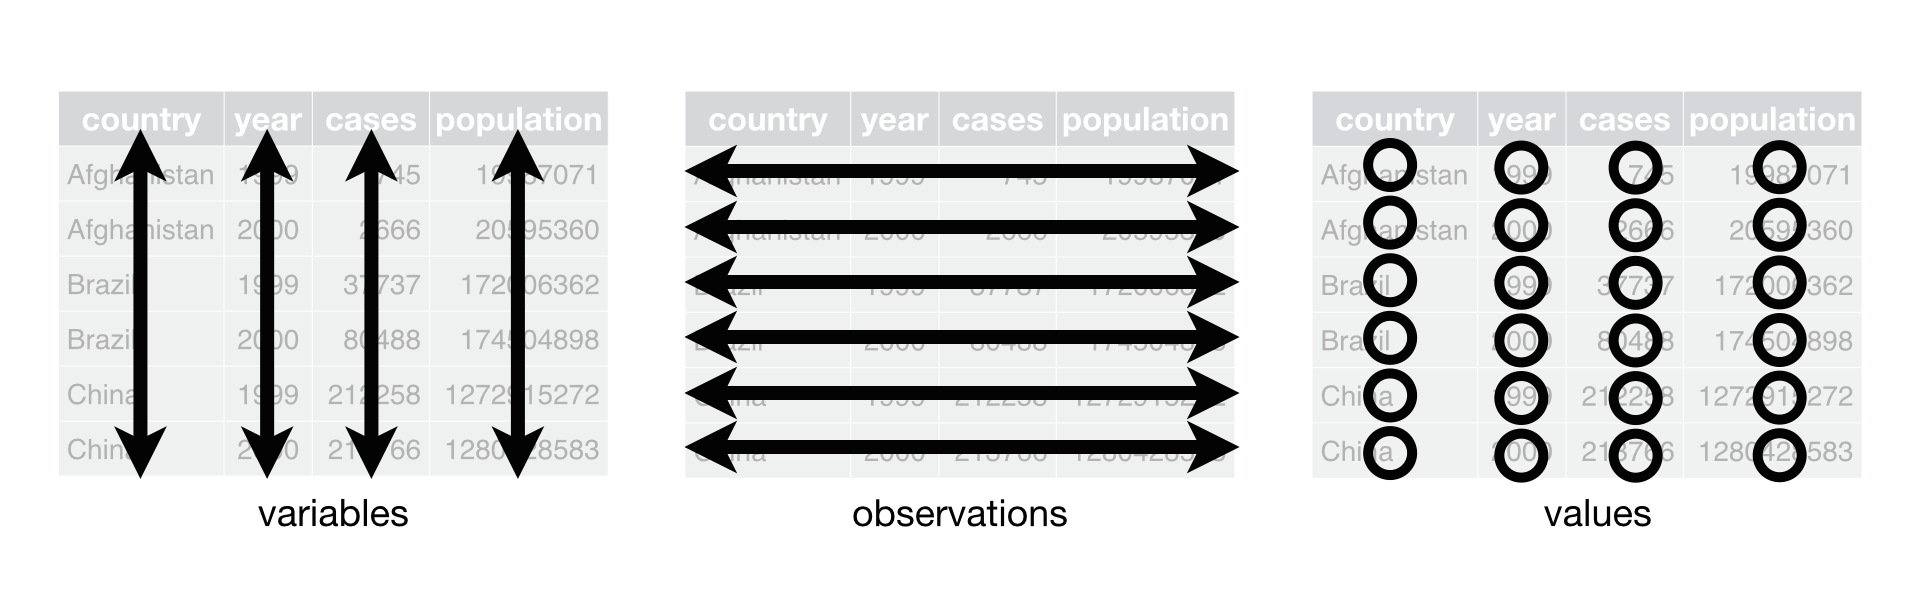
Tidy Data