This walkthrough uses the built-in test profile to demonstrate the complete two-phase workflow. We suggest you start by running the local CLI example. If you will be using Seqera Platform for production runs, proceed to running the test profile there after running the local CLI example.
Step 1: Run the Test Profile (Phase 1)
The test profile automatically downloads a small dummy dataset containing:
A minimal subset of images from one well (both Cell Painting and Barcoding arms)
Pre-configured CellProfiler pipelines
A sample
Barcodes.csvfile
The pipeline will:
Download the test dataset
Run illumination calculation and application
Run segmentation (Cell Painting) and barcode calling (Barcoding)
Generate QC montages
Stop before stitching (this is expected behavior)
Local CLI
nextflow run broadinstitute/nf-pooled-cellpainting \
    -profile test,docker \
    --outdir results
Expected runtime: 15-20 minutes locally
Seqera Platform
In Seqera Platform, on the sidebar select Launchpad and then click Add Pipeline.
Set the following variables:
| Setting | Value |
|---|---|
| Name | test-pipeline |
| Pipeline to launch | https://github.com/broadinstitute/nf-pooled-cellpainting |
| Revision | main |
| Compute environment | Your AWS Batch environment |
| Work directory | s3://your-bucket/prefix/to/scratch/output |
| Config profiles | test |
Select Add
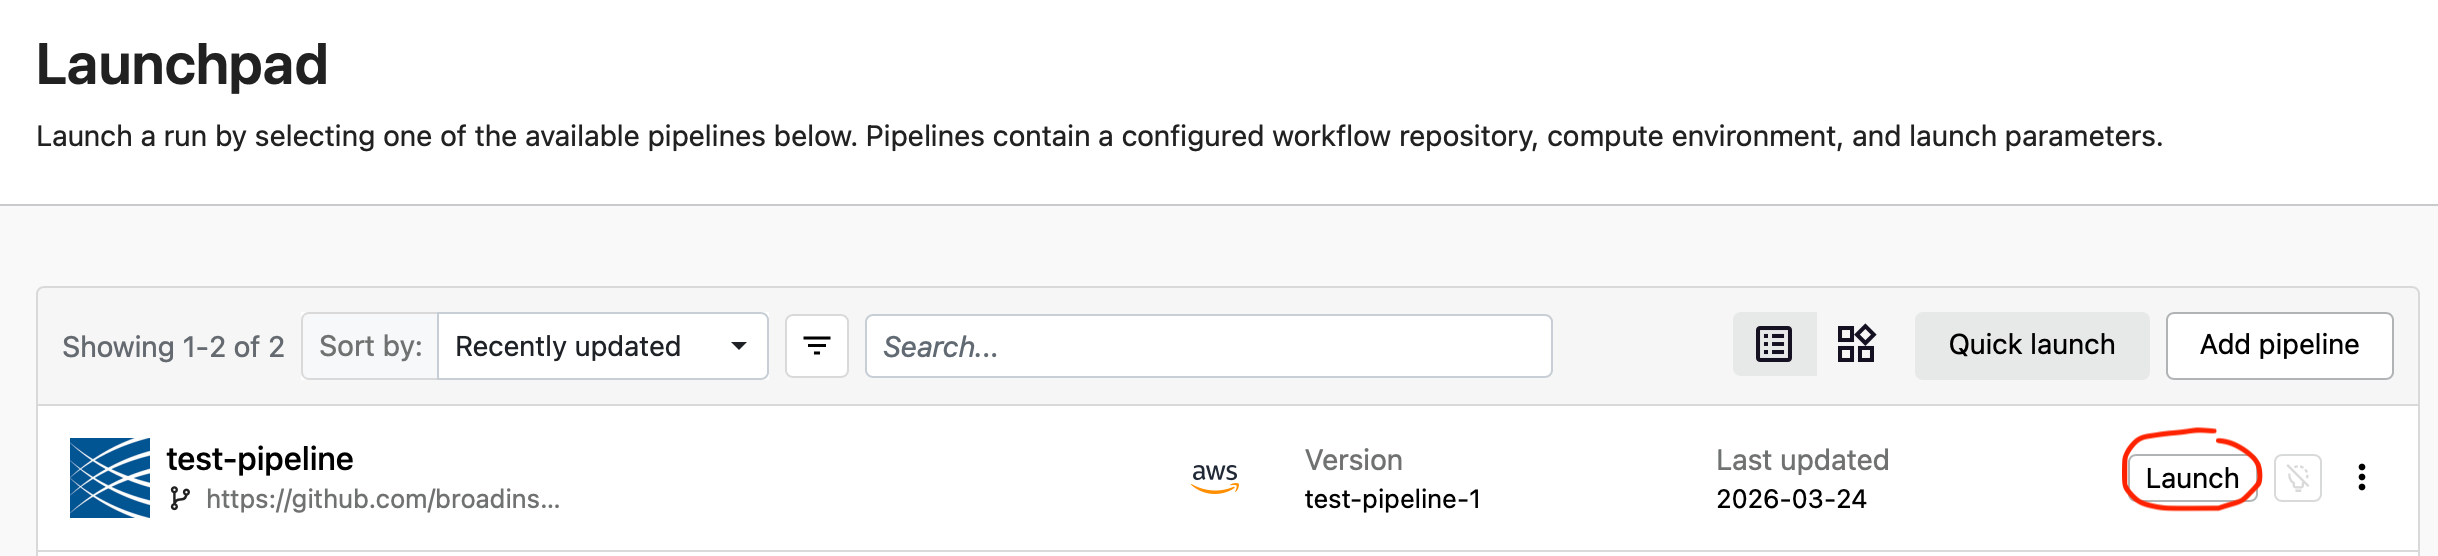
Next to the newly created test-pipeline from the Launchpad select Launch.
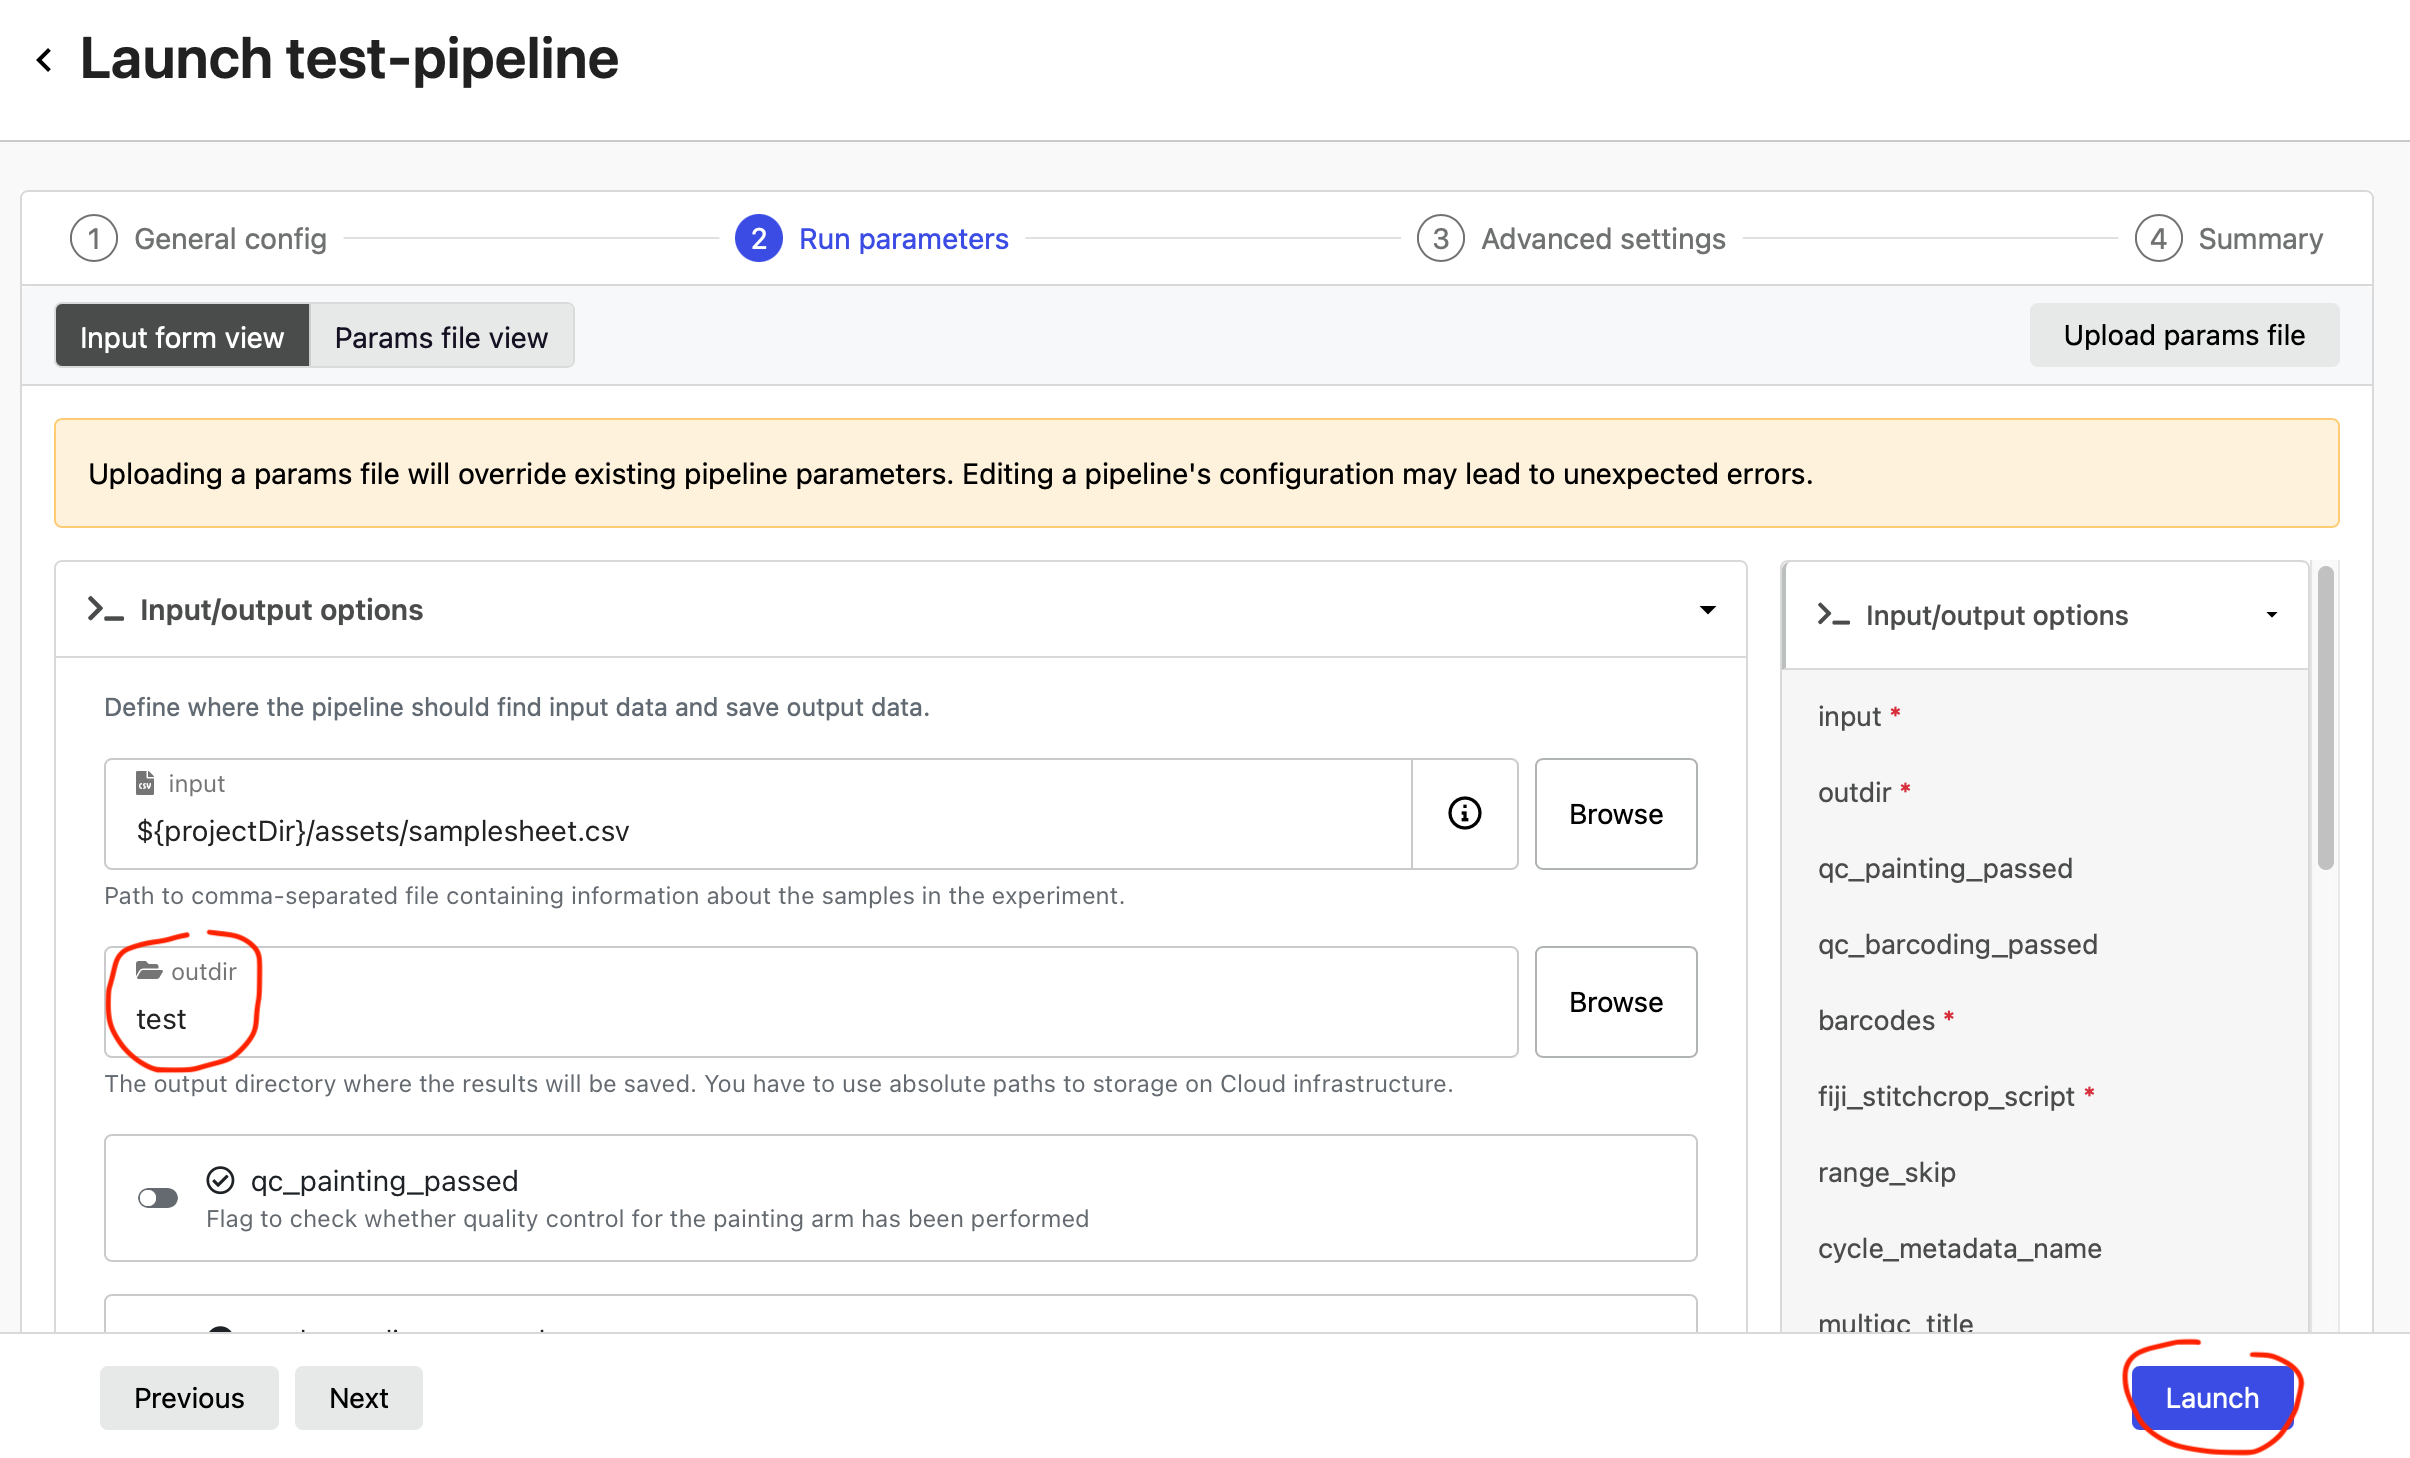
In the Run parameters of the test-pipeline, enter an S3 path where your data should be output into outdir (e.g. s3://my-bucket/output-folder/) and select Launch.
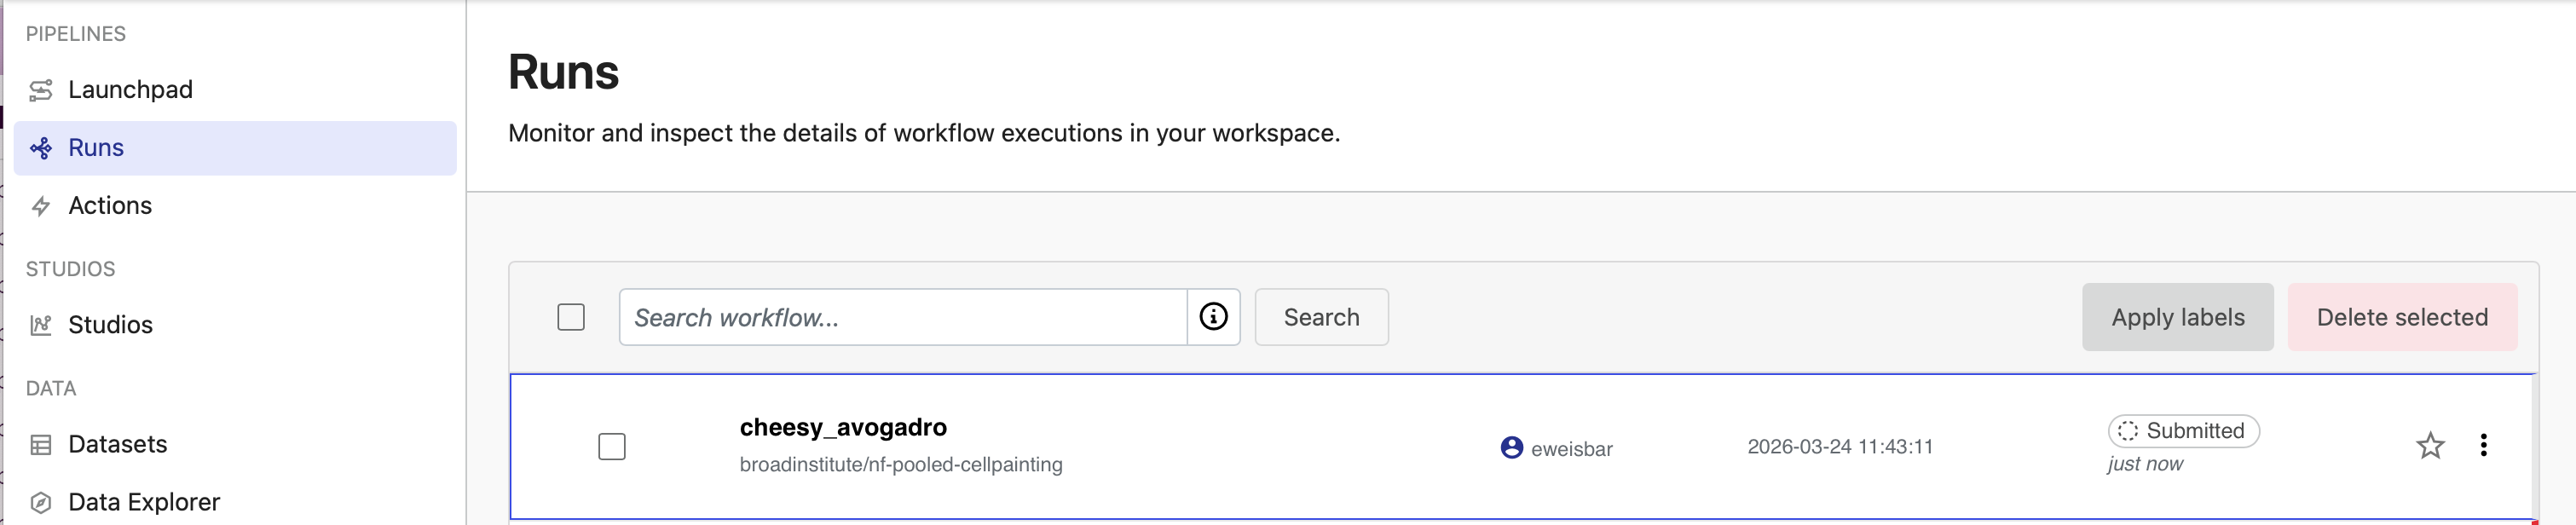
In the Runs view you can see your newly created run. If you click on the run it will show you the status of the workflow modules as they run and complete.
Expected runtime: 5-10 minutes on AWS Batch
Step 2: Inspect QC Outputs
On real data, you would check for the following QC criteria. Note that the test data is too small to produce meaningful QC, but you can still look at the outputs to see that they are created:
Illumination montages: Smooth, gradual intensity variations (not patchy)
Segmentation previews: Cell/nucleus outlines accurately trace boundaries
Alignment reports: Small, consistent pixel shifts across the field
Local CLI
Navigate to results/workspace/qc_reports/ and inspect the contents of the folders:
results/workspace/qc_reports/
├── 1_illumination_painting/
├── 3_segmentation/
├── 5_illumination_barcoding/
├── 6_alignment/
└── 7_preprocessing/
Seqera Platform
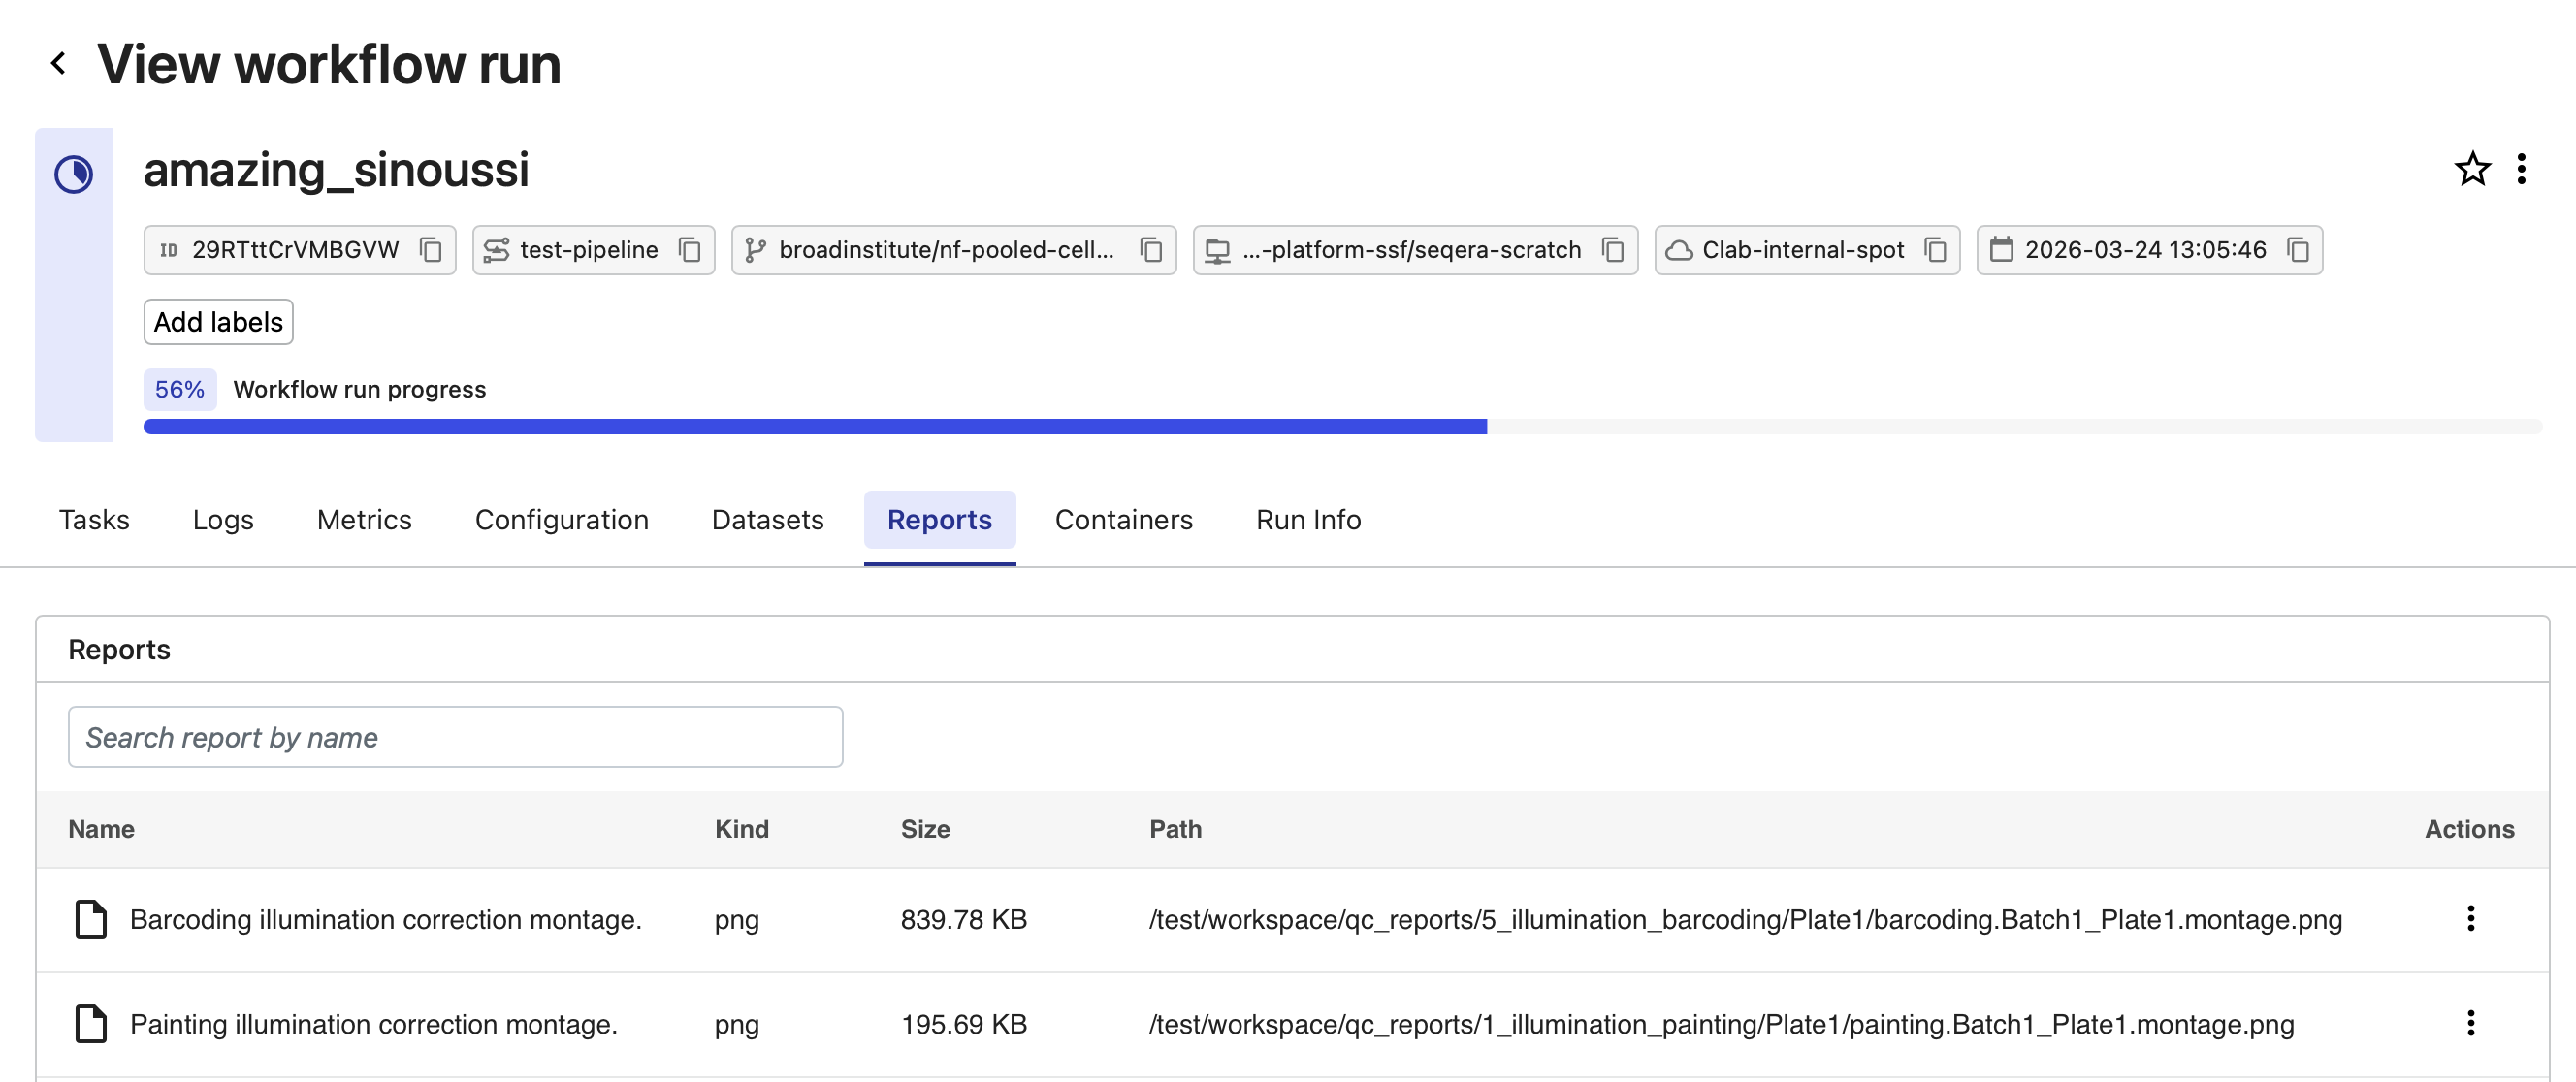
Select the Reports tab and select each of the individual reports to examine them.
Step 3: Complete the Run (Phase 2)
Resume with QC flags set to true.
Local CLI
nextflow run broadinstitute/nf-pooled-cellpainting \
    -profile test,docker \
    --outdir results \
    --qc_painting_passed true \
    --qc_barcoding_passed true \
-resumeSeqera Platform
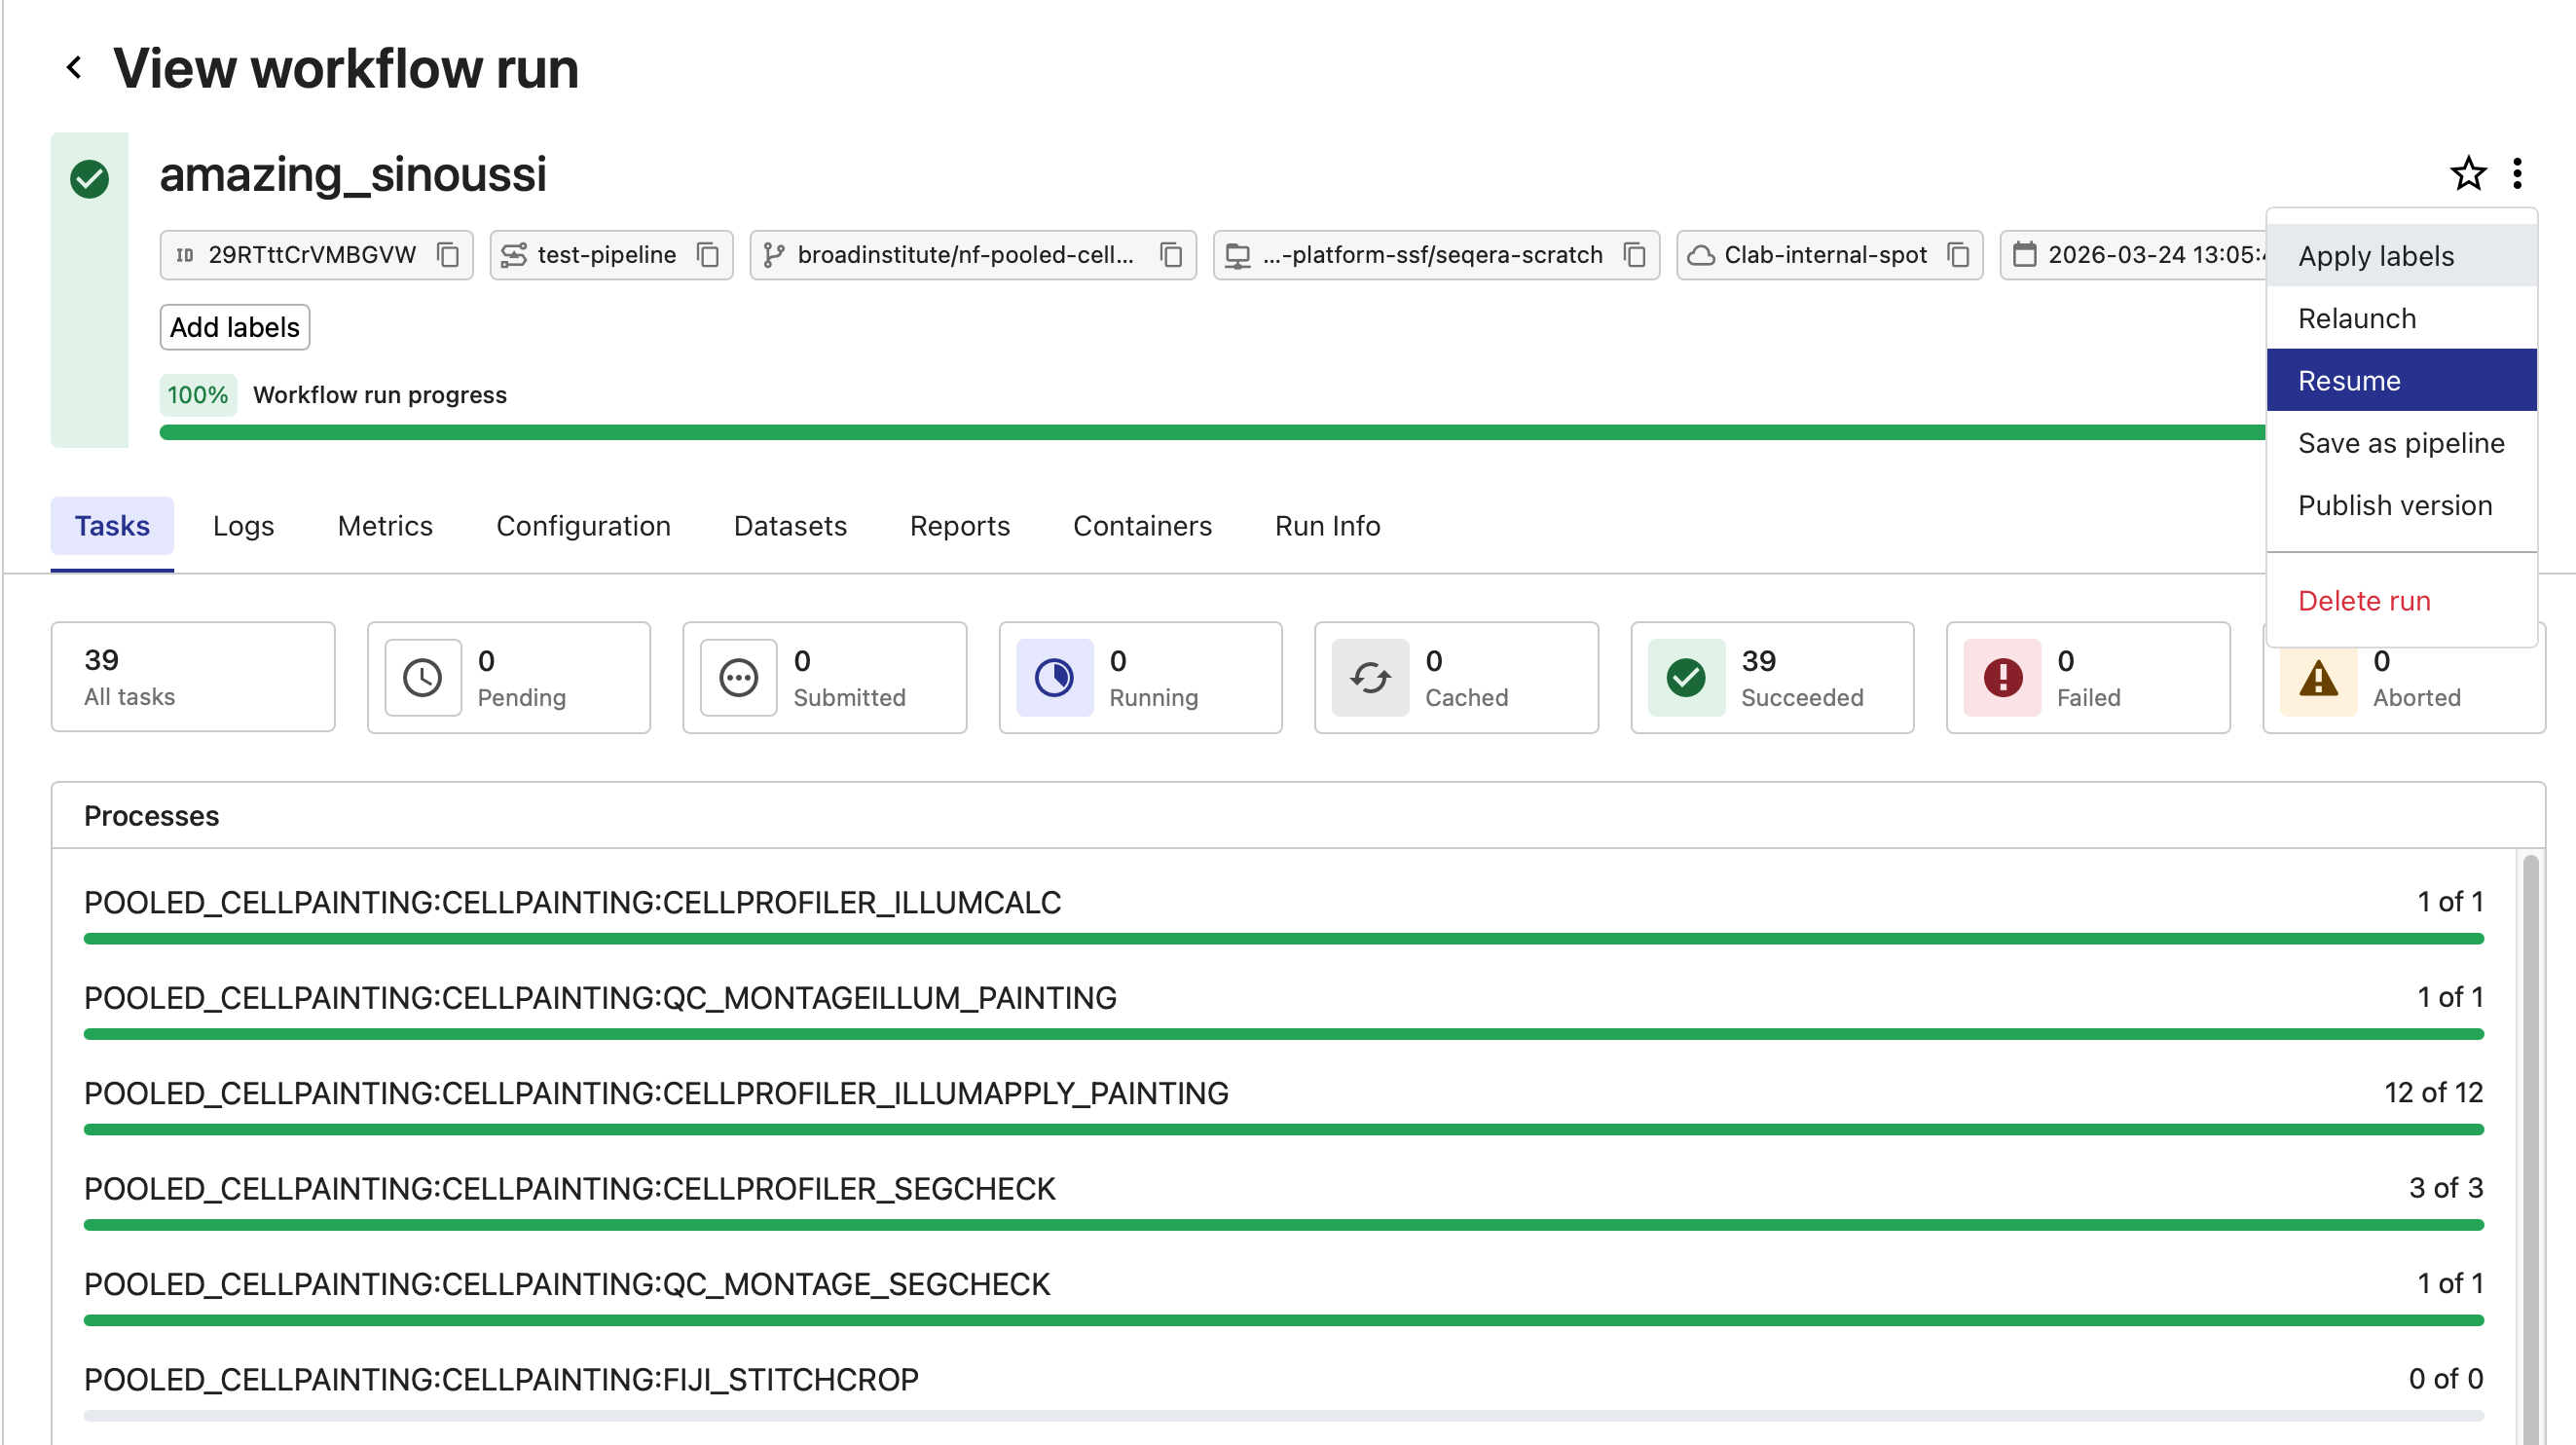
Open the hamburger menu in the upper right and select “Resume”.
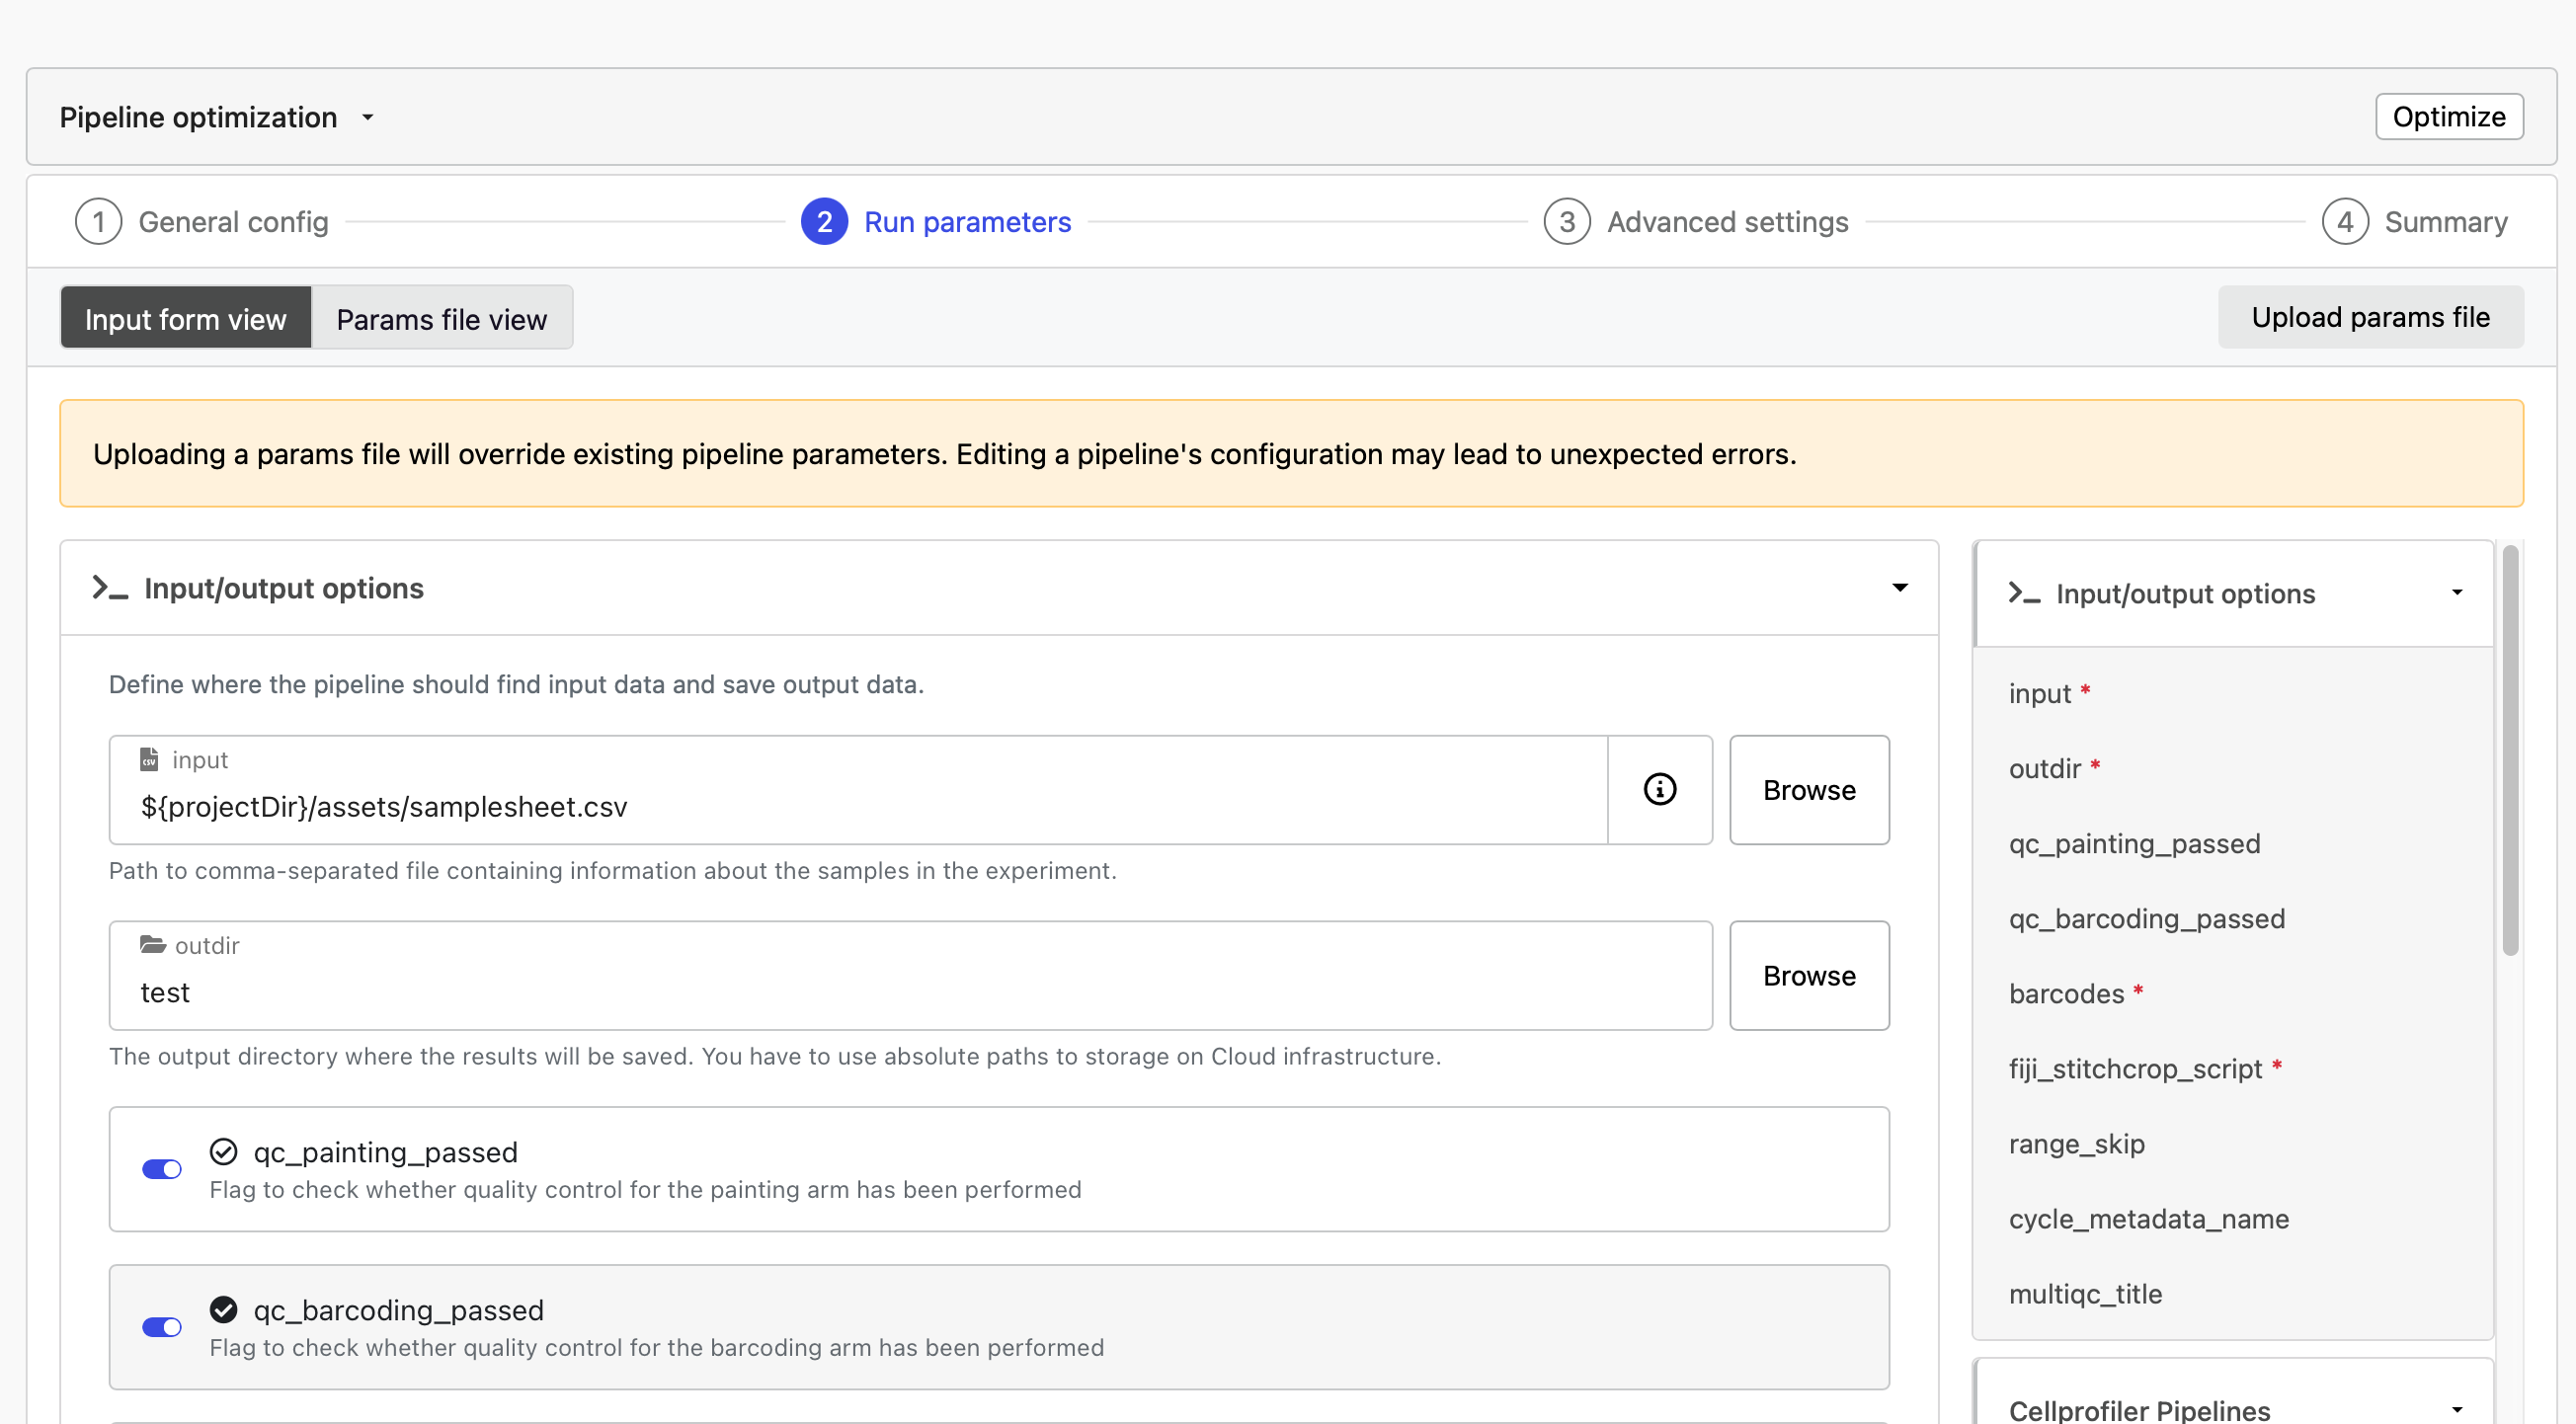
In the run parameters, toggle the qc_painting_passed and qc_barcoding_passed on. Select Launch.
Step 4: Explore Final Outputs
After completion, your results/ directory (either local for a local CLI run or in your S3 bucket for Seqera Platform) contains:
results/
├── images/                    # All processed images by batch/stage
│   └── Batch1/
│       ├── illum/
│       ├── images_corrected/
│       ├── images_corrected_cropped/
│       └── images_corrected_stitched/
├── workspace/
│   ├── analysis/              # Final CSV results (most important!)
│   ├── load_data_csv/         # CellProfiler input files
│   └── qc_reports/            # QC visualizations
├── multiqc/                   # Summary report
└── pipeline_info/             # Execution logs and metrics
The most important outputs are in results/workspace/analysis/—CSV files containing linked phenotype and genotype data for every cell.