GISTIC2 Documentation

Module Name: GISTIC2
Description: Genomic Identification of Significant Targets in Cancer, version 2.0
Authors: Gad Getz, Rameen Beroukhim, Craig Mermel, Steve Schumacher and Jen Dobson
Date: 27 Mar 2017
Release: 2.0.23

Summary:

The GISTIC module identifies regions of the genome that are significantly amplified or deleted across a set of samples. Each aberration is assigned a G-score that considers the amplitude of the aberration as well as the frequency of its occurrence across samples. False Discovery Rate q-values are then calculated for the aberrant regions, and regions with q-values below a user-defined threshold are considered significant. For each significant region, a "peak region" is identified, which is the part of the aberrant region with greatest amplitude and frequency of alteration. In addition, a "wide peak" is determined using a leave-one-out algorithm to allow for errors in the boundaries in a single sample. The "wide peak" boundaries are more robust for identifying the most likely gene targets in the region. Each significantly aberrant region is also tested to determine whether it results primarily from broad events (longer than half a chromosome arm), focal events, or significant levels of both. The GISTIC module reports the genomic locations and calculated q-values for the aberrant regions. It identifies the samples that exhibit each significant amplification or deletion, and it lists genes found in each "wide peak" region.

Resources:

Publications:

Input Parameters

Variable Name refers to the input parameter when running GISTIC by calling it as a MATLABTM function; Option String refers to the command-line parameter when running GISTIC as a stand-alone executable program.

Variable Name Option String     Description
base_dir -b The directory in which to save all output files. (REQUIRED)
seg_file -seg Path to segmented data input file (REQUIRED, see below for file description).
refgene -refgene Path to reference genome data input file (REQUIRED, see below for file description).
markers (file path) -mk Path to markers input file (OPTIONAL, but encouraged: see below for file description).
markers (numeric) -maxspace Maximum allowed spacing between pseudo-markers, in bases. Pseudo-markers are generated when the markers file input is omitted. Segments that contain fewer than this number of markers are joined to the neighboring segment that is closest in copy number. (DEFAULT=10,000)
t_amp -ta Threshold for copy number amplifications. Regions with a copy number gain above this positive value are considered amplified. Regions with a copy number gain smaller than this value are considered noise and set to 0. (DEFAULT=0.1)
t_del -td Threshold for copy number deletions. Regions with a copy number loss below the negative of this positive value are considered deletions. Regions with a smaller copy number loss are considered noise and set to 0. (DEFAULT=0.1)
join_segment_size -js Smallest number of markers to allow in segments from the segmented data. Segments that contain fewer than this number of markers are joined to the neighboring segment that is closest in copy number. (DEFAULT=4)
qv_thresh -qvt Significance threshold for q-values. Regions with q-values below this number are considered significant. (DEFAULT=0.25)
ext -ext Extension to append to all output files. (DEFAULT='', no extension)
fname -fname Base file name to prepend to all output files. (DEFAULT no output basename)
remove_X -rx Flag indicating whether to remove data from the sex chromosomes before analysis. Allowed values= {1,0}. (DEFAULT=1, remove X,Y)
cap -cap Minimum and maximum cap values on analyzed data. Regions with a log2 ratio greater than the cap are set to the cap value; regions with a log2 ratio less than -cap value are set to -cap. Values must be positive. (DEFAULT=1.5)
run_broad_analysis -broad Flag indicating that an additional broad-level analysis should be performed. Allowed values = {1,0}. (DEFAULT = 0, no broad analysis).
broad_len_cutoff -brlen Threshold used to distinguish broad from focal events, given in units of fraction of chromosome arm. (DEFAULT = 0.98)
use_two_sided -twoside Flag indicating that a two-dimensional quadrant figure should be created as part of a broad analysis. Allowed values = {1,0}.(DEFAULT=0, no figure).
ziggs.max_segs_per_sample -maxseg Maximum number of segments allowed for a sample in the input data. Samples with more segments than this threshold are excluded from the analysis. (DEFAULT=2500)
res -res Resolution used to create the empirical distributions used to estimate background probabilities. Lower values generate more accurate results at a cost of greater computation time. (DEFAULT=0.05)
conf_level -conf Confidence level used to calculate the region containing a driver. (DEFAULT=0.75)
do_gene_gistic -genegistic Flag indicating that the gene GISTIC algorithm should be used to calculate the significance of deletions at a gene level instead of a marker level. Allowed values= {1,0}. (DEFAULT=0, no gene GISTIC).
do_arbitration -arb Flag for using the arbitrated peel-off algorithm when resolving the significance of overlapping peaks. Allowed values= {1,0}. (DEFAULT=1, use arbitrated peel-off)
peak_types -peak_type Method for evaluating the significance of peaks, either robust (DEFAULT) or loo for leave-one-out.
arm_peeloff -armpeel Flag set to enable arm-level peel-off of events during peak definition. The arm-level peel-off enhancement to the arbitrated peel-off method assigns all events in the same chromosome arm of the same sample to a single peak. It is useful when peaks are split by noise or chromothripsis. Allowed values= {1,0}. (DEFAULT=0, use normal arbitrated peel-off)
sample_center -scent Method for centering each sample prior to the GISTIC analysis. Allowed values are median, mean, or none. (DEFAULT=median)
conserve_disk_space -smalldisk Flag indicating that large MATLABTM objects should not be saved to disk. Allowed values= {1,0}. (DEFAULT=0, save large).
use_segarray -smallmem Flag indicating that the SegArray memory compression scheme should be used to reduce the memory requirements of the computation for large data sets. Computation is somewhat slower with memory compression enabled. Allowed values= {1,0}. (DEFAULT=1, compress memory)
write_gene_files -savegene Flag indicating that gene tables should be saved. Allowed values= {1,0}. (DEFAULT=0, don't save gene tables)
gene_collapse_method -gcm Method for reducing marker-level copy number data to the gene-level copy number data in the gene tables. Markers contained in the gene are used when available, otherwise the flanking marker or markers are used. Allowed values are mean, median, min, max or extreme. The extreme method chooses whichever of min or max is furthest from diploid. (DEFAULT=mean)
save_seg_data -saveseg Flag indicating that the preprocessed segmented data used as input for the GISTIC analysis should be saved (in matlab format). Allowed values= {1,0}. (DEFAULT=1, save segmented input data)
save_data_files -savedata Flag indicating that native MatlabTM output files should be saved in addition to text data. Allowed values= {1,0}. (DEFAULT=1, save MatlabTM files)
use set_verbose_level() -v Integer value indicating the level of verbosity to use in the program execution log. Suggested values = {0,10,20,30}. 0 sets no verbosity; 30 sets high level of verbosity. (DEFAULT=0)

Input Files

  1. Segmentation File (-seg) REQUIRED

    The segmentation file contains the segmented data for all the samples identified by GLAD, CBS, or some other segmentation algorithm. (See GLAD file format in the Genepattern file formats documentation.) It is a six column, tab-delimited file with an optional first line identifying the columns. Positions are in base pair units.

    The column headers are:

    Example Segmentation File

  2. Markers File (-mk) OPTIONAL

    The markers file identifies the marker positions used in the original dataset (before segmentation) for array or capture experiments. As of GISTIC release 2.0.23, the markers file is an optional input - if omitted, pseudo markers are generated as uniformly as possible using the maxspace input parameter.

    The markers file is a three column, tab-delimited file with an optional header. The column headers are:

    Example Markers File

  3. Reference Genome File (-refgene) REQUIRED

    The reference genome file contains information about the location of genes and cytobands on a given build of the genome. Reference genome files are created in MatlabTM and are not viewable with a text editor. The GISTIC 2.0 release has four reference genomes located in the refgenefiles directory: hg16.mat, hg17.mat, hg18.mat, and hg19.mat.

  4. Array List File (-alf) OPTIONAL

    The array list file is an optional file identifying the subset of samples to be used in the analysis. It is a one column file with an optional header (array). The sample identifiers listed in the array list file must match the sample names given in the segmentation file.

    Example Array List File

  5. CNV File (-cnv) OPTIONAL

    There are two options for the file specifying germ line CNVs to be excluded from the analysis. The first option allows CNVs to be identified by marker name and is platform-specific. The second option allows the CNVs to be identified by genomic location, which is platform independent but genome-build dependent.

    Option #1: A two column, tab-delimited file with an optional header row. The marker names given in this file must match the marker names given in the markers file. The CNV identifiers are for user use and can be arbitrary. The column headers are:

    Option #2: A 6 column, tab-delimited file with an optional header row. The 'CNV Identifier' is for user use and can be arbitrary. 'Narrow Region Start' and 'Narrow Region End' are also not used. The column headers are:

    Example CNV File

Output Files

  1. All Lesions File (all_lesions.conf_XX.txt, where XX is the confidence level)

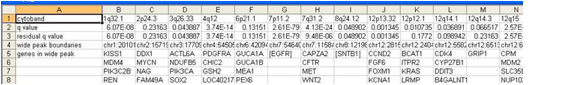
    The all lesions file summarizes the results from the GISTIC run. It contains data about the significant regions of amplification and deletion as well as which samples are amplified or deleted in each of these regions. The identified regions are listed down the first column, and the samples are listed across the first row, starting in column 10.

    Region Data

    Columns 1-9 present the data about the significant regions as follows:

    Sample Data

    Each of the analyzed samples is represented in one of the columns following the lesion data (columns 10 through end). The data contained in these columns varies slightly by section of the file.

    The first section can be identified by the key given in column 9 – it starts in row 2 and continues until the row that reads "Actual Copy Change Given." This section contains summarized data for each sample. A '0' indicates that the copy number of the sample was not amplified or deleted beyond the threshold amount in that peak region. A '1' indicates that the sample had low-level copy number aberrations (exceeding the low threshold indicated in column 9), and a '2' indicates that the sample had high-level copy number aberrations (exceeding the high threshold indicated in column 9).

    The second section can be identified the rows in which column 9 reads "Actual Copy Change Given." The second section exactly reproduces the first section, except that here the actual changes in copy number are provided rather than zeroes, ones, and twos.

    The final section is similar to the first section, except that here only broad events are included. A 1 in the samples columns (columns 10+) indicates that the median copy number of the sample across the entire significant region exceeded the threshold given in column 9. That is, it indicates whether the sample had a geographically extended event, rather than a focal amplification or deletion covering little more than the peak region.

  2. Amplification Genes File (amp_genes.conf_XX.txt, where XX is the confidence level)

    The amp genes file contains one column for each amplification peak identified in the GISTIC analysis. The first four rows are:

    These rows identify the lesion in the same way as the all lesions file.

    The remaining rows list the genes contained in each wide peak. For peaks that contain no genes, the nearest gene is listed in brackets.

  3. Deletion Genes File (del_genes.conf_XX.txt, where XX is the confidence level)

    The del genes file contains one column for each deletion peak identified in the GISTIC analysis. The file format for the del genes file is identical to the format for the amp genes file.

  4. Gistic Scores File (scores.gistic)

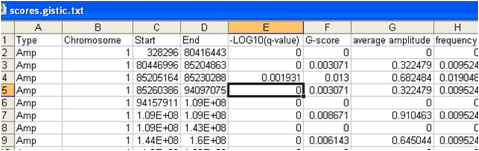
    The scores file lists the q-values [presented as -log10(q)], G-scores, average amplitudes among aberrant samples, and frequency of aberration, across the genome for both amplifications and deletions. The scores file is viewable with the Genepattern SNPViewer module and may be imported into the Integrated Genomics Viewer (IGV).

  5. Segmented Copy Number (raw_copy_number.pdf)

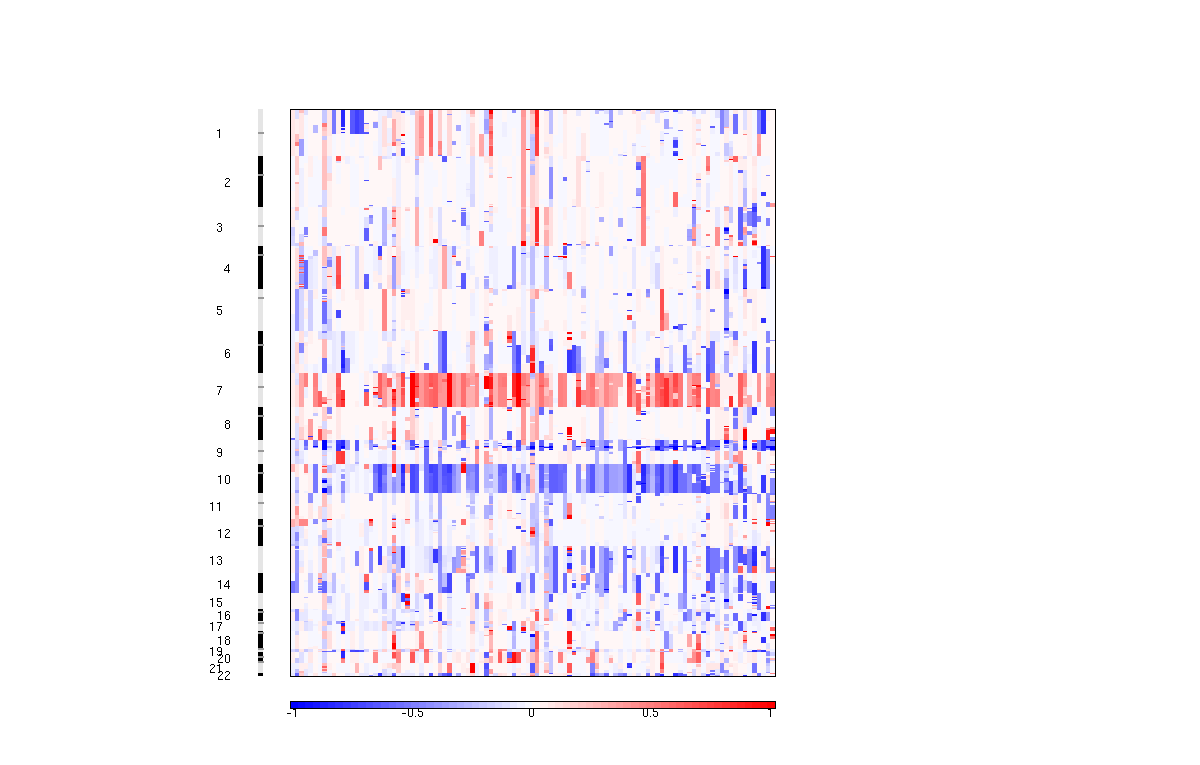
    A .pdf or .png file containing a heatmap image of the genomic profiles of the segmented input copy number data. The genome is represented along the vertical axis and samples are arranged horizontally.

  6. Amplification Score GISTIC plot (amp_qplot.pdf)

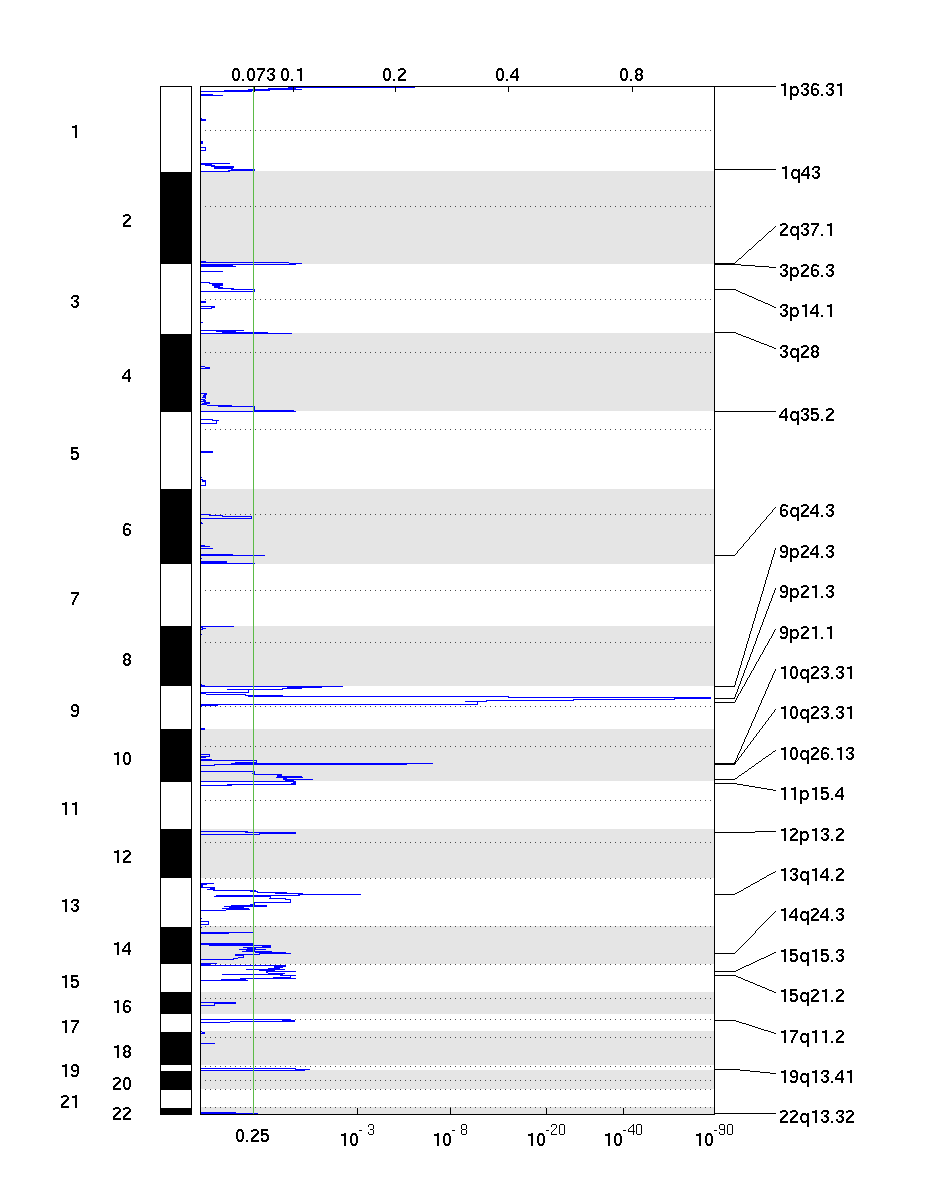
    The amplification pdf is a plot of the G-scores (top) and q-values (bottom) with respect to amplifications for all markers over the entire region analyzed.

  7. Deletion Score/q-value GISTIC plot (del_qplot.pdf)

    The deletion pdf is a plot of the G-scores (top) and q-values (bottom) with respect to deletions for all markers over the entire region analyzed.